
Capital flight
Rising capital shares could reduce city populations

Over the past few decades, the population has increasingly concentrated in a small number of major cities. If AI raises the share of income going to capital, what happens to these urban powerhouses? While some have predicted that housing in prestigious cities will become even more valuable in an AI-driven future—treated as a scarce luxury good in a world of abundance—this view may miss something fundamental about why cities exist in the first place.
People don’t flock to expensive, crowded cities primarily because they love urban living. They move there for higher wages. While cities offer museums and restaurants, this is in practice fully offset by higher crime, commute time and other disamenities, resulting in there being no net effect of city size on amenities. Most major cities aren’t located in places with exceptional natural beauty or ideal climates—they grew where they did for historical reasons of trade, ports, and industry.1 If AI significantly reduces the wage premium that cities offer, the economic logic that keeps millions packed into urban centers weakens dramatically. We might expect a meaningful shift toward areas that people actually prefer to live in—places with more space, lower costs, and better natural amenities.
To test this hypothesis, we’ll adapt Hsieh and Moretti’s (2019)’s model of urban agglomeration by adding a parameter for exogenous capital income. This capital income is distributed uniformly across locations—everyone receives roughly the same amount regardless of where they live. Why model it thus? In a world where the return on capital remains below the economic growth rate (the r < g condition), most capital income at any point in time still represents someone’s deferred wages from earlier work, rather than inherited wealth passed down through generations.2
Specifically, we’ll redefine utility to be
Where Wi is city wages, K the transfer, Zi city amenities, Pi city prices and beta the expenditure share on housing. As dV/dWi, i.e. the marginal return to an additional $1 of wage earnings, remains constant, while dV/dZ_i has risen by K/P_i^beta, wages will be relatively less important in determining relative housing prices, so high wage areas will fall in relative price. Combining with the equation for labour demand gives a new equilibrium condition of:
Where gamma is the inverse of the city elasticity of supply, P_bar is a constant of the demand curve and theta is a parameter indicating the degree of long mobility. We can solve this using the data from Hsieh and Moretti (2019) for the US and this housing data for the UK.
We also need to establish a baseline: how much exogenous consumption do people effectively receive today? The obvious component is returns on financial assets like stocks and bonds, but for most people these are fairly small. The larger piece comes from government transfers—both cash payments like Social Security and in-kind benefits like Medicare. These transfers are ultimately funded in part by returns to capital (through corporate taxes, capital gains taxes, and general taxation of capital income), making them effectively a form of redistributed capital income from the perspective of recipients. Calculating the exact equivalent flows through several channels. Capital ownership is highly unequal, then gets taxed at various rates, then gets redistributed through government spending—some as cash transfers, some as services like healthcare or education. Working through this implies the average person in the UK effectively receives capital income equivalent to about 28% of their total income, while in the US it’s about 21%.3
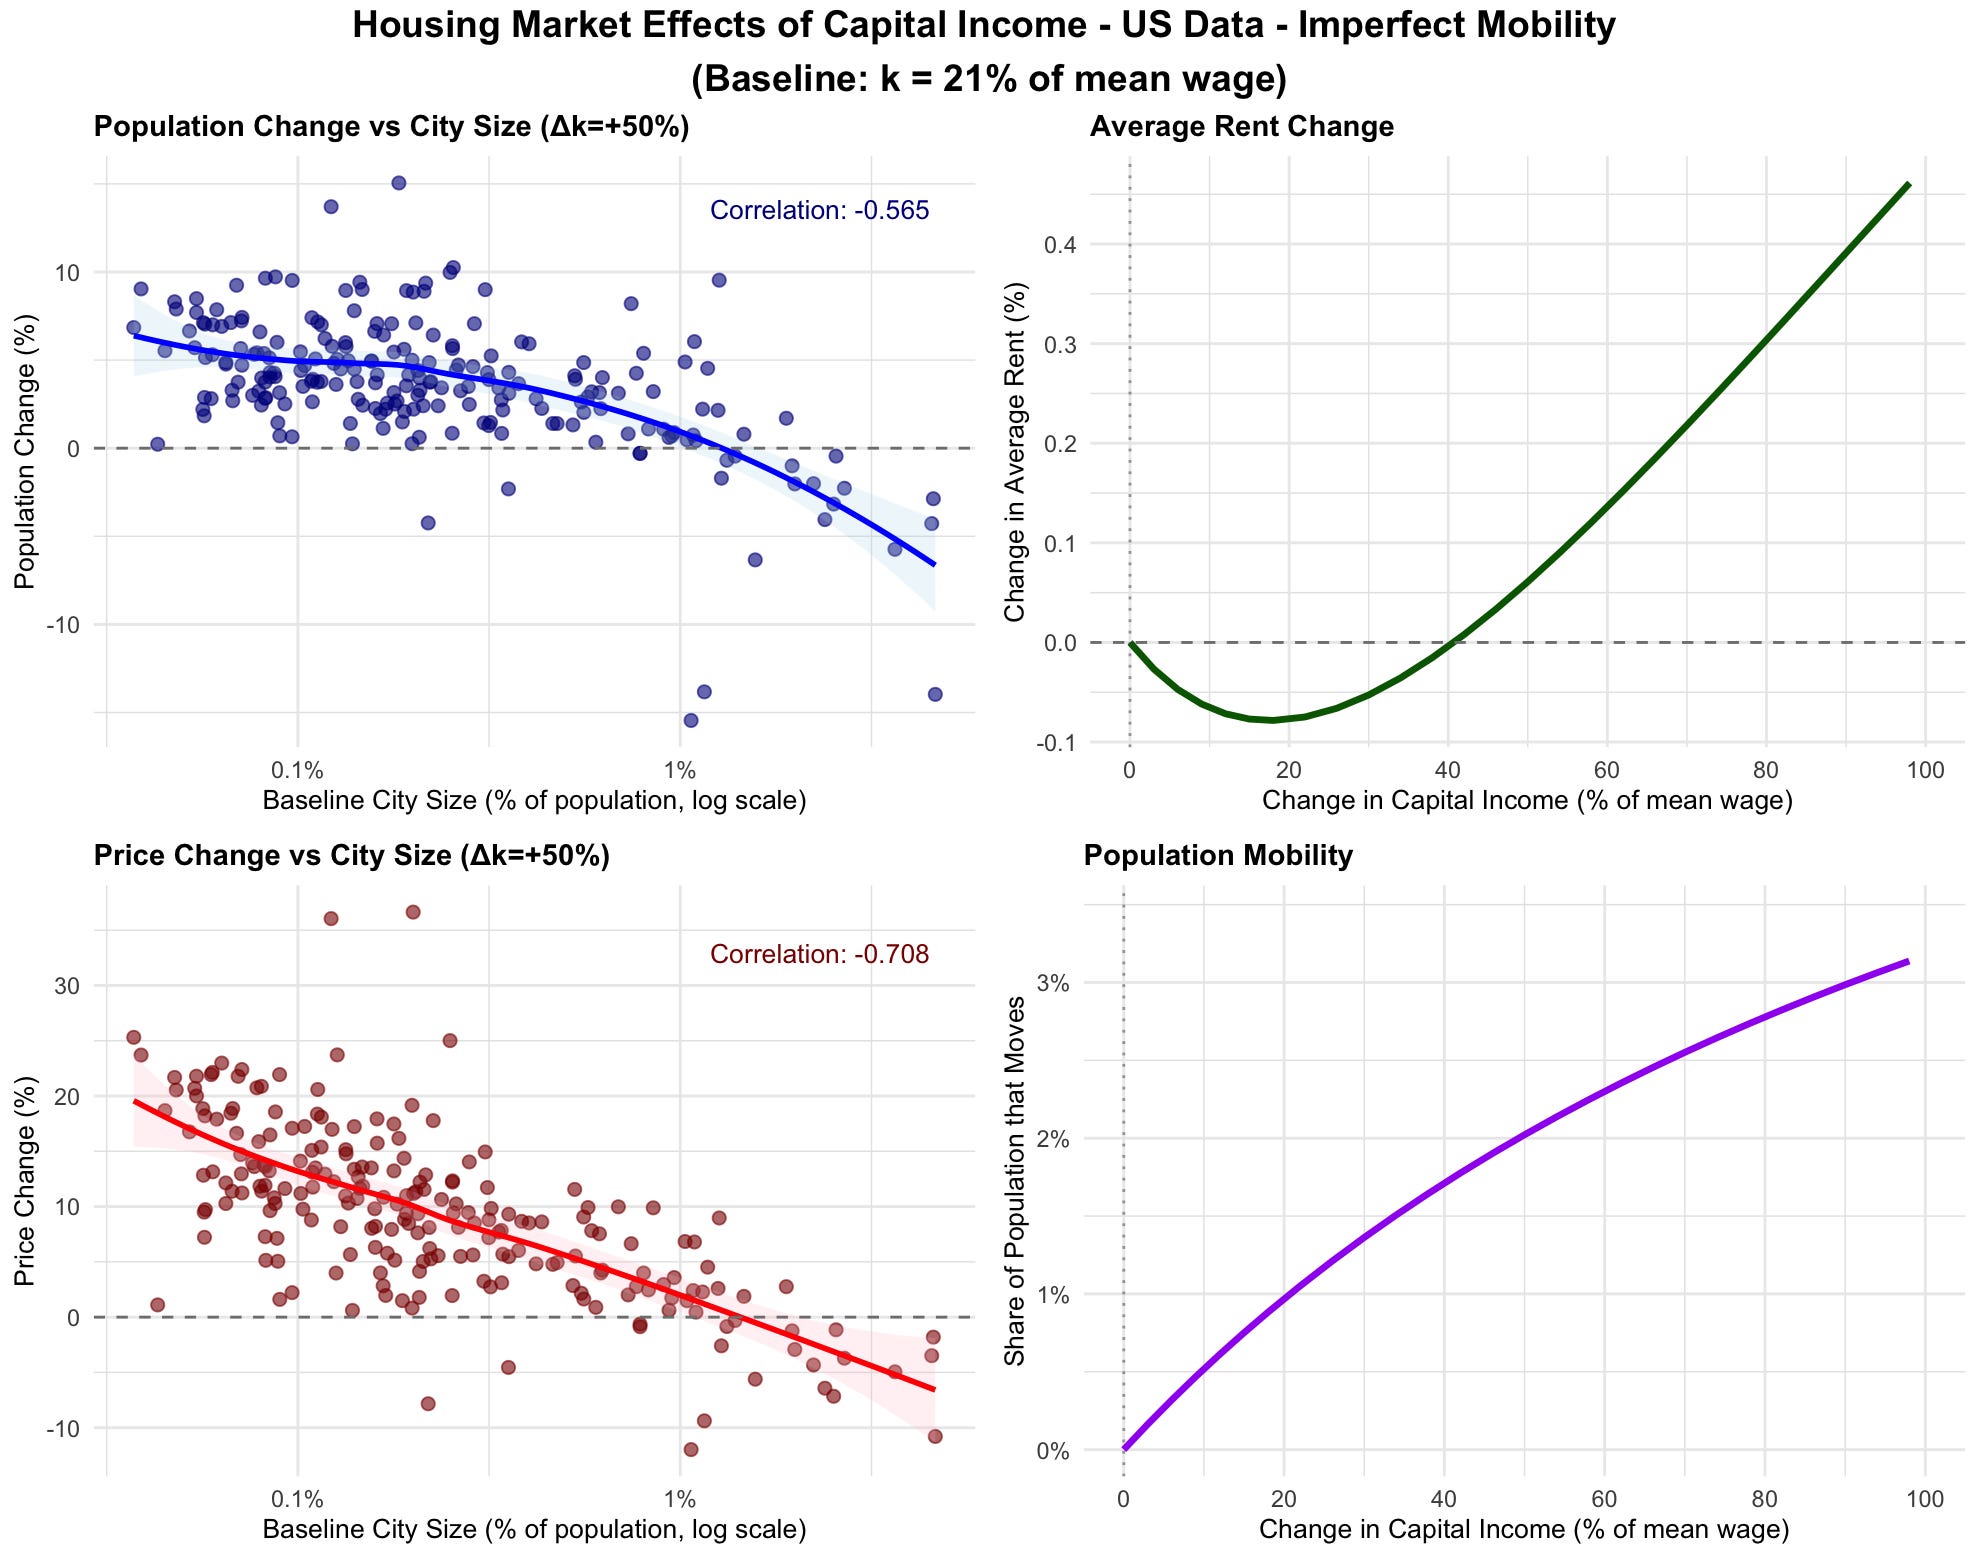
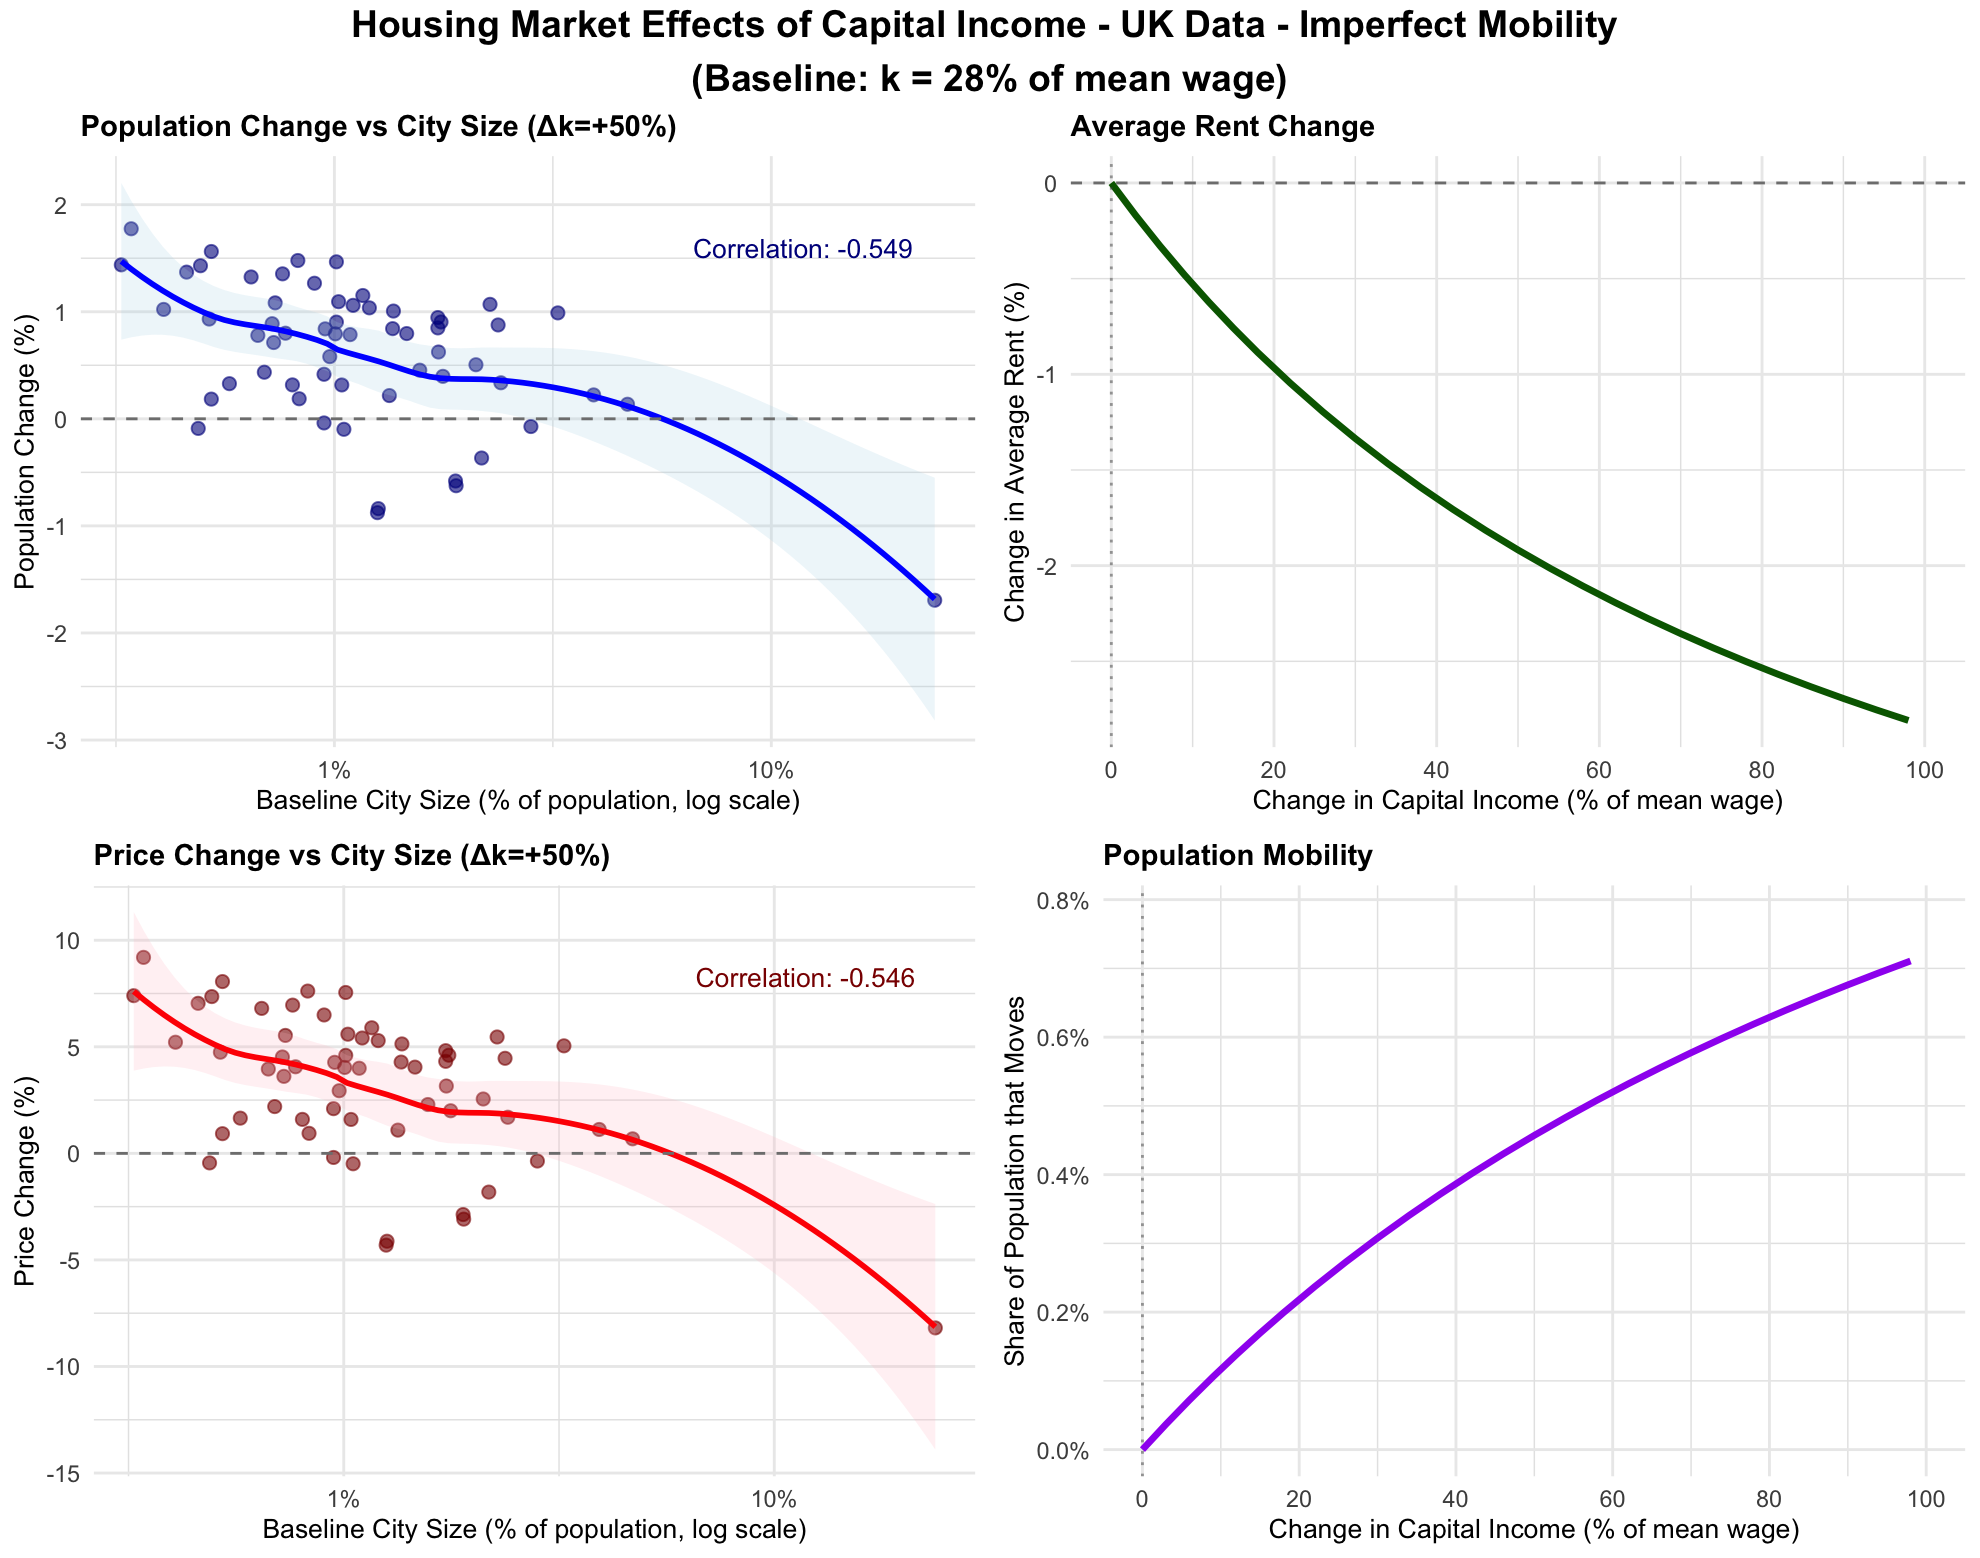
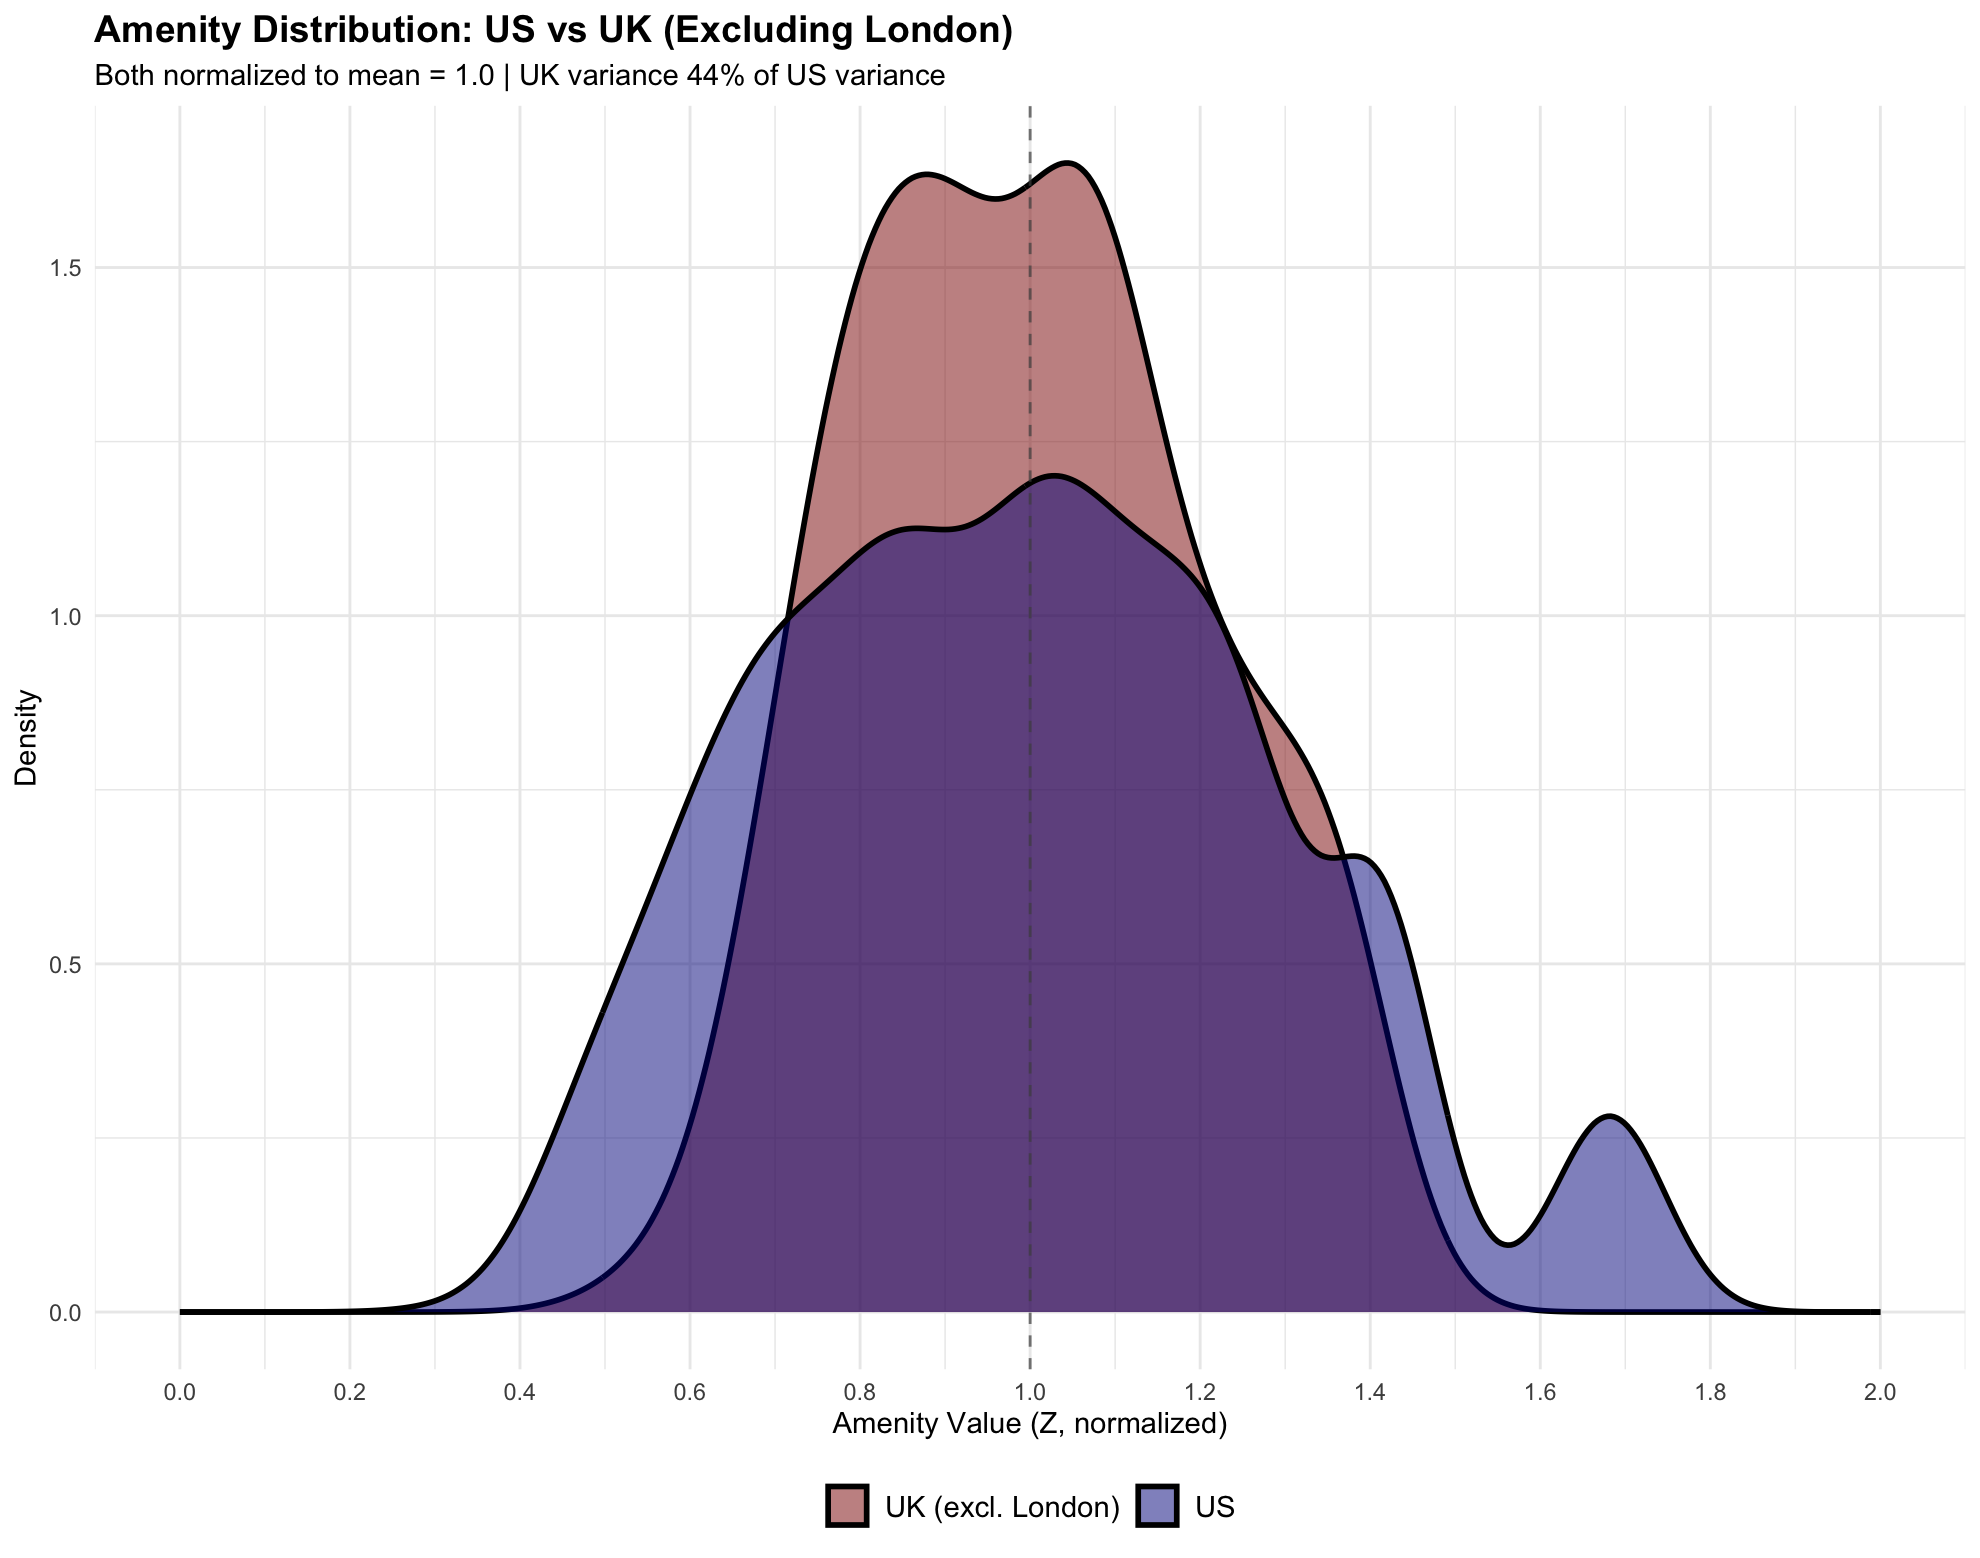
The model produces several striking results. Firstly, aggregate housing prices fall in the UK but rise in the US. This is because in the US, many of the most supply-constrained cities—places like Los Angeles and San Diego with strict zoning—also happen to have genuinely desirable amenities. These cities can maintain their value even as wage premia decline.4 The UK’s curtailed cities, by contrast, are constrained more by historical accident than natural appeal, and see much less movement than American cities with more liberal planning regimes.5 Second, in both countries’ larger cities see bigger drops in both prices and population. This makes intuitive sense—big cities today are big precisely because they offer large wage premiums, and as that advantage erodes, so does their pull. Third, US cities show much steeper price and population swings than UK cities when we account for their size, as US cities differ much more in amenities than UK cities so changes in the desirability of amenities are much more important. This is perhaps unsurprising given the massively greater variance in climatic conditions, and larger variance in local policy, in the US compared to the UK.
Both graphs in levels assume that the income elasticity of demand of housing is zero, or equivalently that the shock is purely to shares with no effect on aggregate income. In practice, any likely shock here would almost certainly boost overall output, and with it housing prices given a rise in housing demand with income.6
City populations could adjust downward fairly substantially in many worlds with higher capital shares, and would plausibly do so more in worlds with more egalitarian distributions of income. Many institutions—political, economic, and financial—are implicitly built around assumptions of a capital share substantially below the labor share. If that assumption doesn’t hold, much else may change.
A fact which sometimes opens up surprising construction opportunities.
Note that in principle lifecycle considerations could still cause problems though.
To estimate this baseline, we take the average distributional impact of transfers, multiply by the tax to GDP ratio, add capital income and then take the average of this for the bottom 80%. We take the figure for the bottom 80% as individuals with higher capital income relative to wages than the average would in this model weakly select out of cities, making their data unrepresentative.
Specifically, the 5 cities in the US with the strictest zoning in Hsieh and Moretti’s model are Los Angeles-Long beach, Fort Lauderdale, San Francisco, San Diego and Salt Lake City-Ogden.
One measure of the tight correlation here: for the average US cities it could not expand onto land with a less than 20 degree incline in 75% of directions. For the UK the figure is below 15% and primarily due to coastal cities.
Although the price elasticity of housing demand is likely somewhat sublinear.