
Gilt by Association
Against Pound Foolish Pension Regulation

UK pensions are governed by two very different regulatory regimes. The difference shows up in the returns. Assets held in Defined Benefit schemes have returned barely half what those in Defined Contribution schemes have since 2007 - £201 versus £448 per £100 invested. The gap is almost entirely explained by regulation.
Today, private sector DB schemes, worth £1.2trn, hold just 18% of their assets in equities and 69% in government bonds.1 DC schemes, worth £600bn, hold 76% in equities.2 This gap exists because DB schemes must match assets to liabilities, which in practice means holding gilts.
The problem is that stocks and bonds have very different long-term returns. Since 1900 global equities have returned 5.0% per annum after inflation, compared to 1.7% for bonds.3 This 3.3 percentage point annual gap compounds relentlessly: over a 40-year career, £100 in equities grows to roughly £700 in real terms; in bonds, under £200. Equities are more volatile year-to-year, but over pension-relevant horizons of a decade or more, real equity returns actually exhibit lower variance than bonds - nominal bond values depend on the price level, which could end up almost anywhere, while equity values track GDP, which is far more predictable over decades.
DB pensioners might receive fixed benefits, but they funded those benefits through decades of contributions.4 When that money earns 2% instead of 5%, pensioners or trustees lose the difference.
The regulatory origins of this gap trace to the 1995 Pensions Act, which introduced minimum funding requirements tied to gilt yields. The 2004 Pensions Act and subsequent guidance accelerated the shift: DB schemes went from holding 61% equities in 2006 to just 18% today. For comparison, the global average pension allocation to equities is 45% - Canada’s CPP holds 59%, Australian super funds 56%. UK DB schemes hold less than half the international norm.
This post quantifies the costs of current asset allocations. 96% of private sector DB schemes are closed to new members, with the switch generally having occurred between 2006 and 2012, hence the gains accrue to individuals who started work before 2012. We build a lifecycle model tracking cohorts of UK pensioners from 1925 to 2075, computing the consumption and welfare gains from returning DB allocations to historical norms. We find that switching to a 75% equity allocation would boost pensioner consumption by £381 billion in present value, generate £201 billion in additional tax revenue, raise bequests by £177bn and improve welfare even after accounting for increased portfolio risk.
Model
How large are the gains from returning to pre-2006 allocations? A back-of-the-envelope calculation is straightforward: shifting from 25% to 75% equities raises expected returns by just short of 3 percentage points, implying annual gains of around £40 billion on £1.4 trillion of DB assets, diminishing over time as DB schemes wind down. But this naïve approach leaves a key question unanswered: when do pensioners choose to take their consumption? To properly account for how rational savers would adjust their spending in response to improved investment prospects, we need to model optimal consumption paths, not just terminal wealth.
Individuals work from age 22 to 67, with wages growing at 1% per annum from experience (on top of 1% economy-wide real growth). They face mortality risk based on UK actuarial tables, adjusted so that life expectancy rises over time at historical rates. A fixed proportion of salary flows into pensions: pre-2006, all contributions enter DB schemes; from 2006-2012, new contributions transition linearly toward DC; post-2012, all new contributions are DC.5 Contribution rates are calibrated to match the actual observed sizes of the DB and DC pension pools, and fees are 0.4%/annum. Retirees also hold £200k of housing wealth, the average for 65-74 year olds, which returns 3.5% giving untaxed consumption via imputed rent every year.
In retirement, individuals face stochastic returns determined by their portfolio’s asset allocation and optimise their drawdown rates accordingly. Stocks return 7% pre-volatility drag with 18% standard deviation, while bonds return 1% with 5% standard deviation.6 Preferences follow a standard CRRA utility function with risk aversion η = 3 and a 3.5% discount rate. Bequests are valued at 10% of equivalent terminal consumption, and are assumed to be consumed entirely during the recipient’s working life—they therefore affect welfare but do not feed back into the retired population’s consumption.7 Individuals face a 15% probability of needing care towards the end of their life, in which case £75,000 will be subtracted from their bequest.
Results
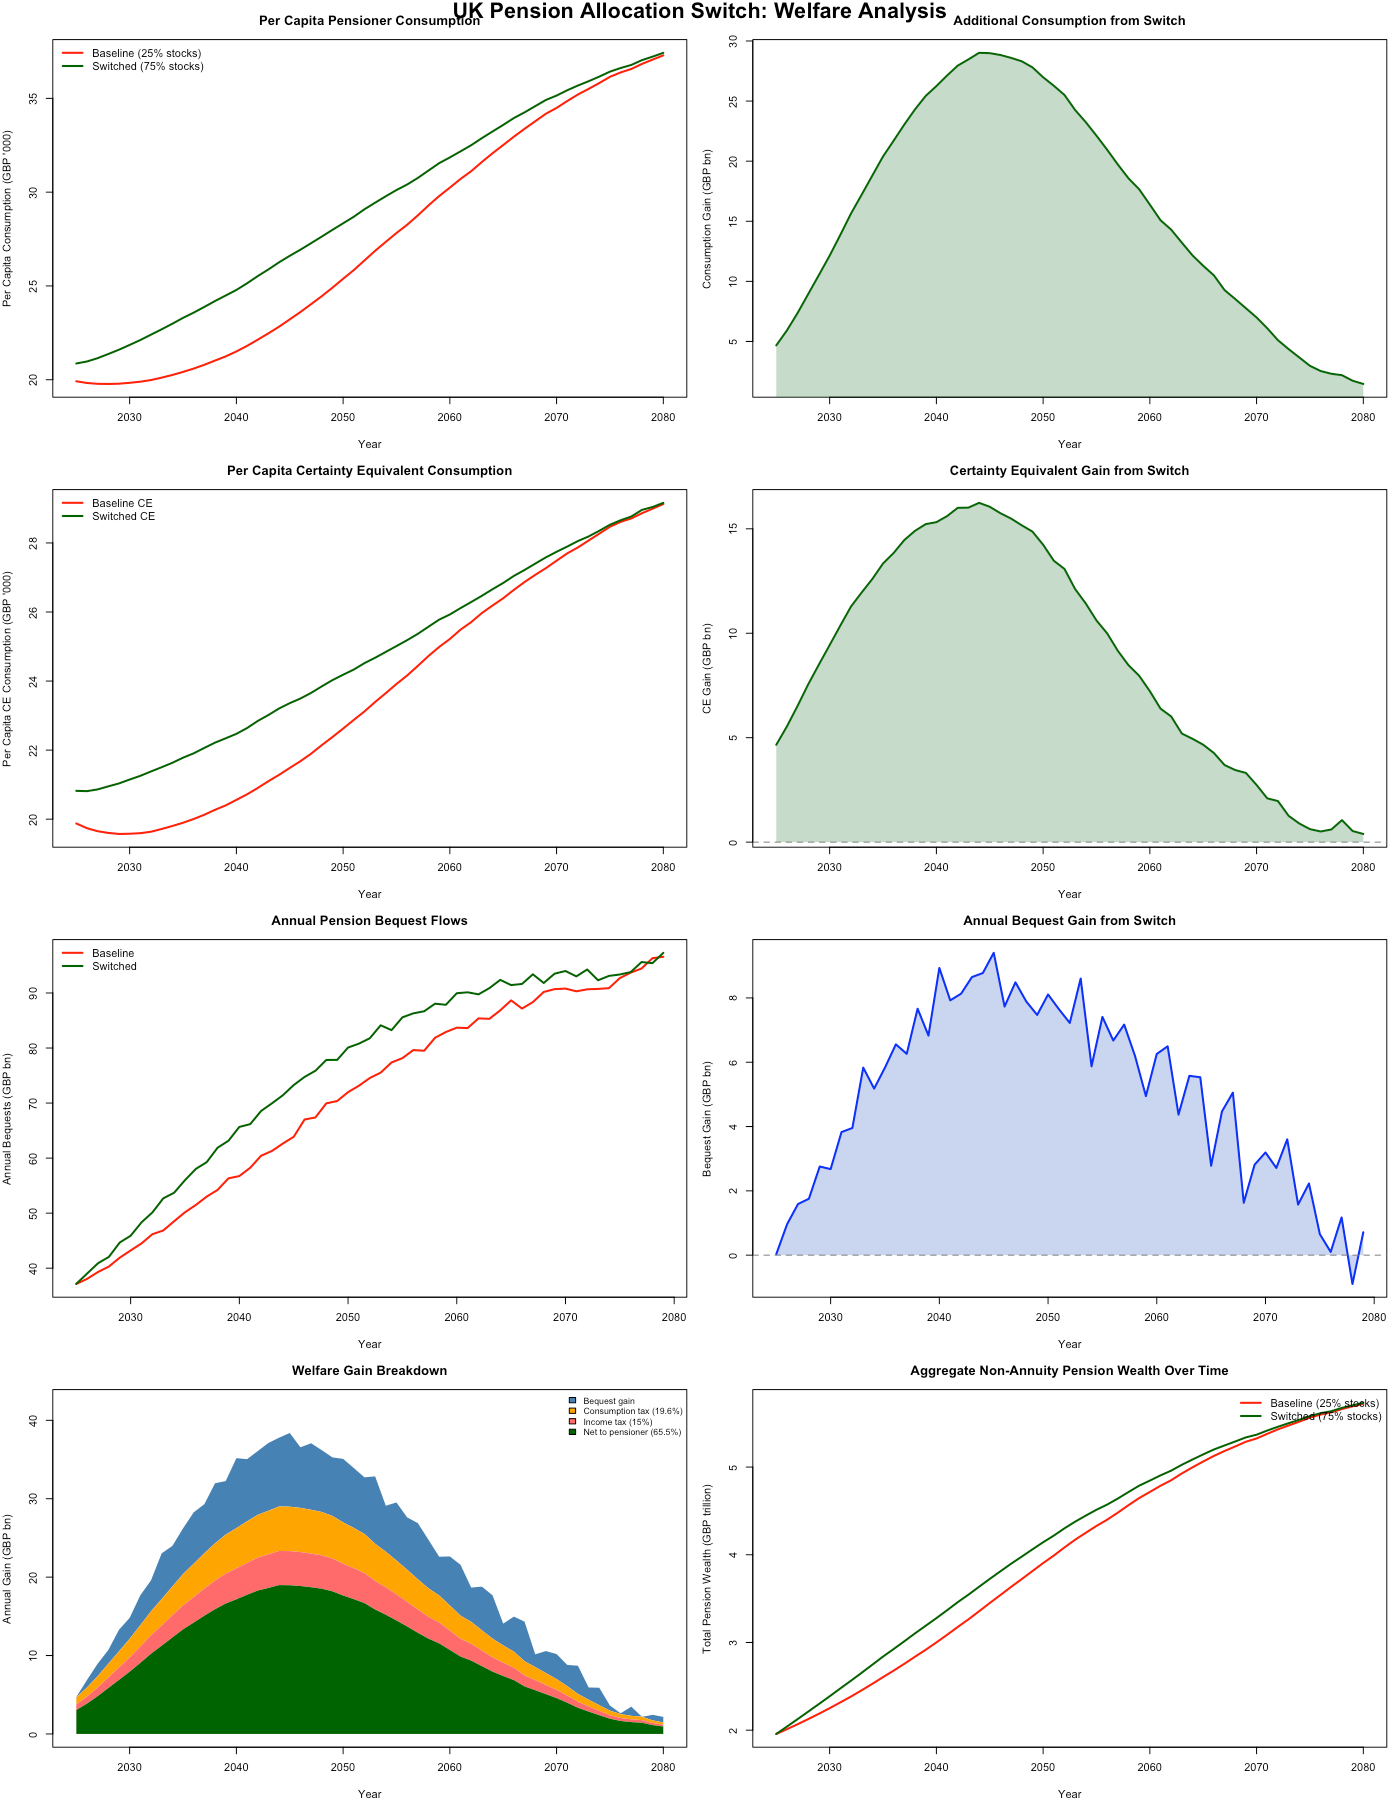
The results of this are visible above.8 Consumption rises immediately as existing pensioners anticipate higher future returns, with the total effect coming to £381bn in present value (post-tax). Bequests also rise by £177bn present value, due to both higher wealth and higher risk encouraging greater precautionary asset holdings. The annual consumption gain peaks in the early 2040s, then declines as the DB-holding population ages and shrinks. The cohort that most benefits is those born in 1960 (aged 65 today), gaining a mean of £37,300 in expected consumption. Importantly, these gains remain positive in every period even after adjusting for risk: certainty-equivalent gains, which account for the disutility of increased portfolio volatility, are 57% (£218bn) of the headline figures.
The reform generates £201 billion in present value tax revenue (6.4% of GDP). This estimate is conservative: it assumes all pension income is taxed at the basic rate, that all retirees take their full 25% tax-free lump sum, and ignores inheritance tax entirely.9
Debt financing
The gains above flow from assets that currently sit in government bonds—so any reform is simultaneously a fiscal event. Shifting £500+ billion out of gilts would reduce captive demand for public debt, pushing up yields at a time when the UK’s fiscal position is already strained. This cost must be modelled directly. That said, DB schemes are winding down regardless: the Treasury will eventually lose this captive buyer whether or not reform accelerates the timeline.10
The cumulative reallocation represents 349 1% GDP demand shock years. What yield impact should we expect? Moretti et al. (2024) estimate a price elasticity of demand for emerging market sovereign debt of -0.3, implying a 1% GDP demand reduction raises yields by around 4.7 basis points. Other studies find smaller elasticities (-0.05 (EU) to -0.15 (US)). However, if the yield-demand relationship is stable in levels rather than elasticities, then higher debt stocks mechanically reduce the per-unit elasticity—and modern developed economies carry roughly twice the debt-to-GDP ratios of the emerging market sample (mean 54.7% in Moretti et al. (2024)). This suggests a plausible range of 1.6-4.7bp per 1% GDP demand shock, worth 5.5%-16.7% of GDP present value (£171-492 billion). The true figure is likely towards the lower end of that range as the lowest estimates refer to European countries directly comparable to the UK while the highest refer to emerging markets with much less institutional credibility.11
In fact, this cost could be fully offset by adjusting the maturity structure of government debt. The UK’s weighted average maturity (WAM) stands at 15 years—double that of any other G7 country and 2.5 times the US average of 6 years. This is no coincidence: the UK has been able to issue at such long maturities precisely because pension funds were required to buy duration-matched assets. In effect, the Treasury took the benefit of captive demand in the form of longer maturities rather than lower yields. But most models suggest this was not optimal - Greenwood et al. (2015) find that shorter-maturity debt minimises expected financing costs, and provides a natural hedge in recessions when interest rates fall and fiscal needs rise. Extrapolating from Belton et al (2018), the UK’s maturity premium costs approximately 30 basis points in yield - worth 9% of GDP in present value.12 Combined with the £201 billion in additional tax revenue, this would fully fund the proposal even under the most pessimistic assumptions about yield sensitivity.
Policy implications
How could reform be enacted? For LGPS, implementation is straightforward: the Secretary of State can issue directives under Regulation 7 of The Local Government Pension Scheme (Management and Investment of Funds) Regulations 2016 that all council investment strategies must be compatible with, and could mandate a 75% equity target tomorrow. As such pensions are DB, this would only improve their funding ratio however, with the surplus accruing to the government or local councils. Similar modest incentives to those proposed below could be used to encourage individual conversion to DC.
For private sector DB schemes, an existing mechanism - Cash Equivalent Transfer Value (CETV) transfers - already gives individuals a statutory right to move from DB to DC schemes.13 But current rules stack the deck against transferring: members must accept an implicit haircut if the scheme is underfunded, and must obtain financial advice that, following Pensions Regulator guidance, is highly likely to recommend against switching.14 Moreover, the same arguments for holding equities that apply to pension funds apply to a similar extent to individuals’ own savings, yet the UK public holds remarkably little in stocks, implying some public information efforts would be necessary to induce take-up.
To reduce these frictions, three changes would help. First, remove the underfunding haircut: if a scheme is 90% funded in expectation, let members transfer the full value of their assets and whatever entity previously would have been liable retains responsibility for the shortfall they would have borne had the individual stayed. Second, reverse the regulatory presumption on advice for switches to regulated DC schemes - the Pensions Regulator could update its guidance to reflect the long-term case for equities, reducing both the cost and the friction of mandatory advice. Third, offer a modest incentive: a £1,000 lump sum payment today for those who switch to regulated schemes, with the government informing every potentially affected household about the offer. Even if 10 million people took this offer up, the cost would be under 2% of the expected consumption benefits. The machinery for implementation does exist.
Conclusion
Pension misallocation has substantially reduced the retirement consumption of a generation of UK savers, having cost DB members over half their potential asset value since 2006 - and the supposedly “safe” gilt-heavy strategy still managed to trigger emergency Bank of England intervention in September 2022. The implicit subsidy from forced gilt purchases is a highly inefficient means of financing government debt - and one that could be entirely offset by shortening the maturity structure to international norms. DB reform could thus deliver over £600 billion in additional consumption and bequests to British retirees and older workers over the coming decades at no net fiscal cost.
Defined Benefit (DB) pensions promise a specific retirement income based on salary and years of service; the scheme bears the investment risk. Defined Contribution (DC) pensions are individual savings pots where the member bears the investment risk. The £201 vs £448 comparison applies asset class returns at actual DB (18% equity, 69% gilt) and DC (76% equity) allocations to £100 invested in 2007.
These are geometric returns already accounting for volatility drag.
Indeed, DB schemes are currently funded at 125% of liabilities on average, so such payouts as have been promised should broadly speaking occur.
In practice, many pension funds for previous workers remained open to previous contributions beyond that date: due to lacking data we here ignore this, but note that it could raise the benefits considerably by reducing the weighted average age of holders of DB assets, thus giving greater opportunities for the pots to grow.
Bond return yields are chosen lower than historical data due to the long run decline in interest rates over the past 8 centuries. No such trends are obvious for stocks over the 400 years comparable instruments have existed.
We focus on the £2.2 trillion in pension assets. An additional £700 billion sits in annuities, which would likely raise both consumption and tax revenue from any reform; however, we cannot reliably allocate annuity holdings by age and so exclude them from the analysis. We assume equal ownership of pension assets across individuals: in practice, heterogeneity likely raises the consumption share because the long right tail of the income distribution means that heterogeneity raises the average state pension share of income, lowering risk and thus raising optimal consumption.
We assume immediate full transfer of the assets: gains and costs would both fall approximately proportionately should the policy change be delayed.
Why is the tax take relatively modest compared to the consumption gain? For comparison, furlough cost the exchequer £25 billion net on £70 billion of spending - a 64% rate - whereas here tax revenue is only 27% of the consumption boost. Three factors explain this. First, pensioners face lower effective tax rates: as tax bands are unadjusted for household dependency ratios, pensioners can sustain higher per capita consumption on a lower tax band than working households with children. Second, pensioners are exempt from National Insurance, which adds roughly 20 percentage points to the marginal tax rate on workers (13% employer, 8% employee). Third, imputed rent is untaxed, and pensioners disproportionately own their homes outright. Since the reform’s benefits scale with DB pension wealth, the fiscal case could be strengthened by pairing reform with increased means-testing of transfers to pensioners. Additionally, higher pensioner wealth would slightly reduce expenditures on pension credit, but as pension credit only binds for those without a state pension, while most DB holders are likely to have a full NI history, this makes it unlikely this effect will be large.
While for simplicity we model the reform that pushes all allocations to 75-25, it would likely be optimal for very old individuals today to avoid switching. As the cost is so concentrated in the shift out of bonds over the next few years, this could substantially reduce the total increase in debt interest.
Their steady state projections for debt impacts are larger as they assume surpluses will be reinvested in lowering debt levels, resulting in much greater long run returns from the policy.
Employers are also often keen to remove these liabilities from their books. DB pensions liabilities for funding purposes are discounted at corporate bond rates, while assets are valued at mark to market accounting - but the expected rate of growth of assets in a pension is considerably in excess of corporate bond rates. Hence short run declines in pension funding due to cyclical stock market changes immediately appear on balance sheets under FRS17 (2000), which as both broad stock market declines and individual firm difficulties are correlated due to the economic cycle is likely to be the point when firms generally face strained cash flows.
The implicit haircut arises as the underlying assets are transferred, but underfunded schemes may be bailed out - by active members or employers. By leaving the scheme, individuals currently forgo that transfer opportunity. The presumption against switching can be seen in e.g. FCA Policy Statement PS18/6 (2018), which requires advisers to “start from the assumption that a transfer will be unsuitable”.