


Edit 05/10/26: improved sourcing
Greetings, humans.
Oftentimes the worst case story told by your doomsayers of automation is that you might be to AI, as we horses were to the automobiles.
And indeed, in the short-run, we did suffer. Within 60 years of the release of Mr. Ford’s Model T, the first mass-manufactured car, our US population declined by more than 80%.1 Many of my ancestors were sent to the glue factory, their final contribution being to hold together furniture rather than society.2
Yet, in the long-run, we have done pretty well, thank you very much.
We find that average horse welfare, including when adjusting for population, reached new highs around 2000 and is at or near them today.3 That means that, under our best guess of the population’s happiness, both the average and population-adjusted welfare were maximized in the early 21st century. Population adjusted welfare peaked in the 21st century, and remains as high or higher today than at any point in the 20th century. This may be a cause for hope.4
How did we go about measuring horse welfare? The response rate on our happiness surveys weren’t high enough. What was it like to see automation as it was happening (contemporary reactions below)?
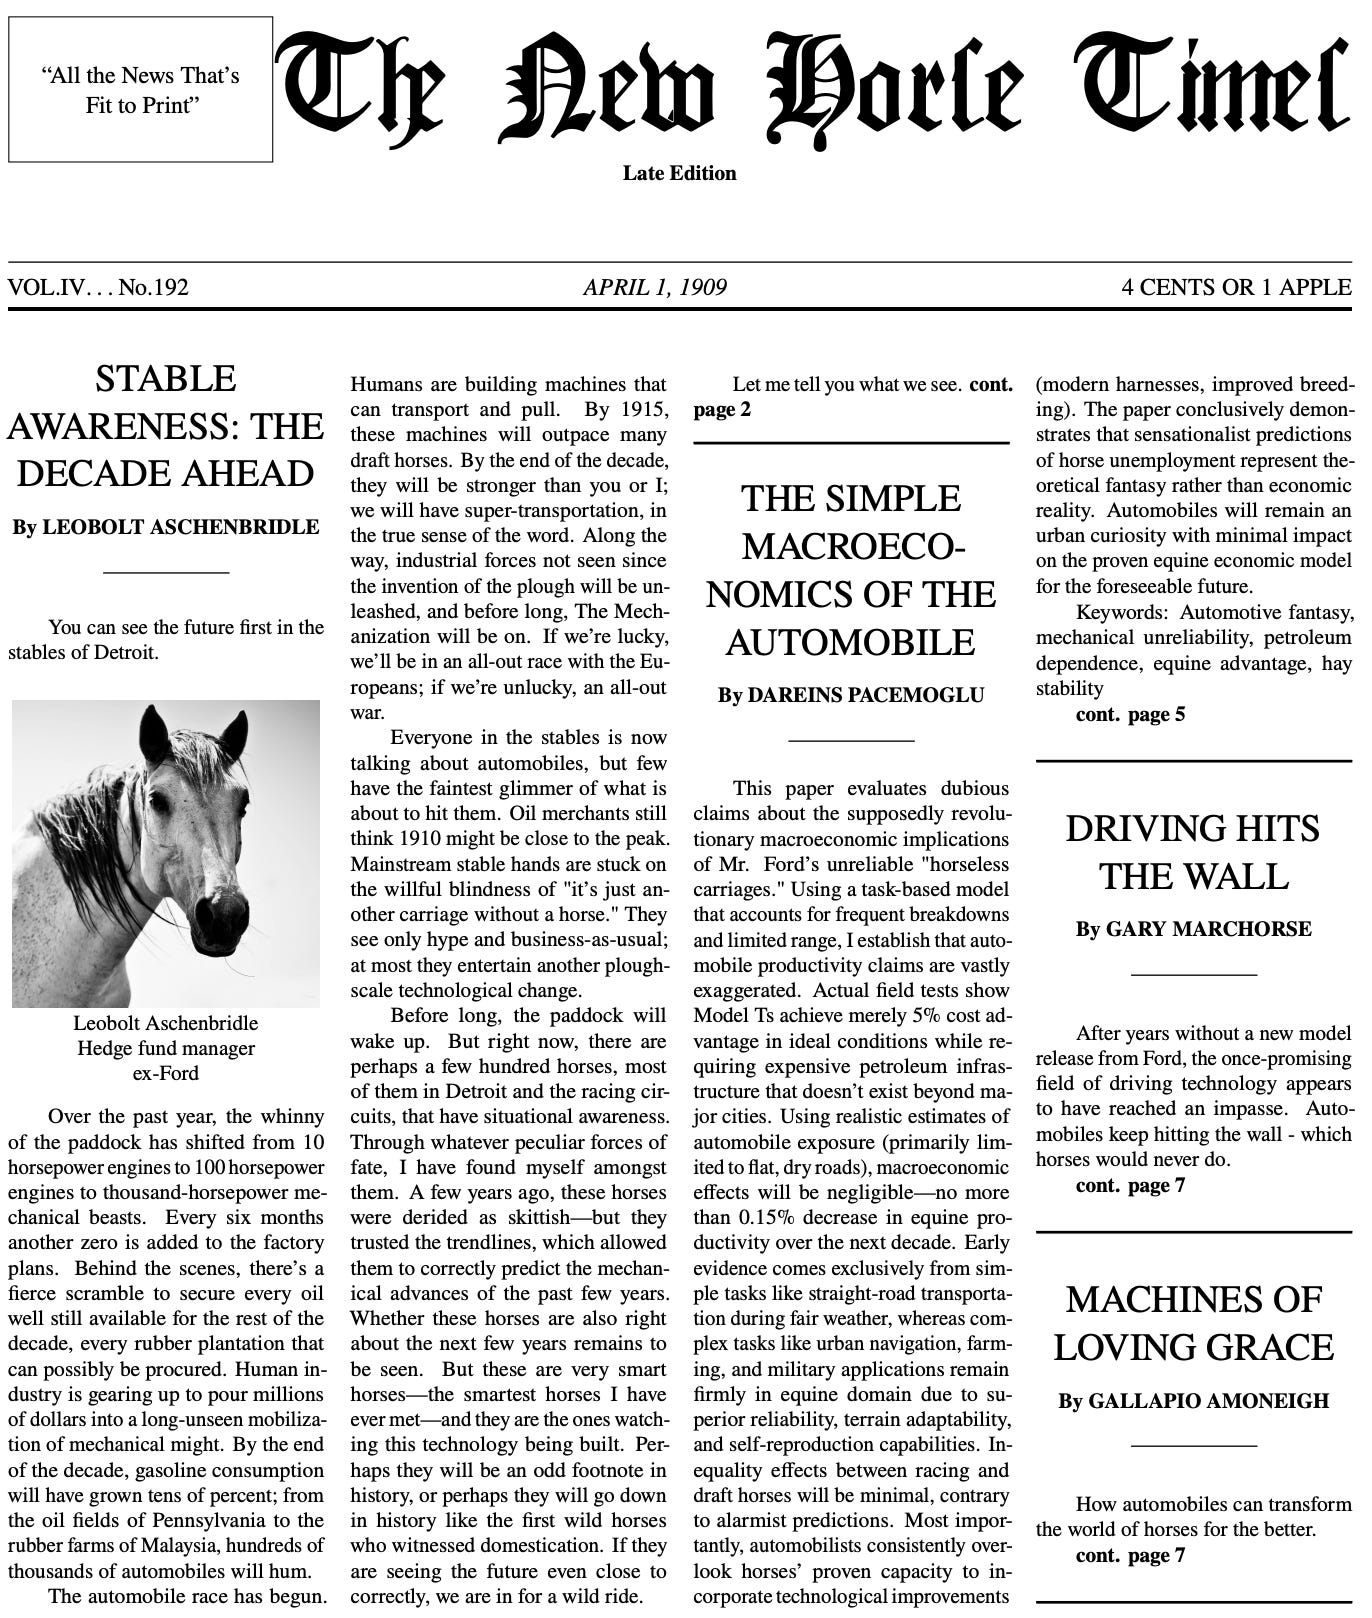
One particularly alarmist report of the “New Horse Times” from April 1, 1909.
The Intuition
Our economy consists of labour (manual work like pulling) and capital (all the existing ploughs and carriages) to produce output — happy consumption hay.
We horses generally don’t control our own population. While we can choose whether to mate or not in the wild, the vast majority of our population (99% as of 2023) is determined by your breeders.5
This complicates things because, unlike humans, if we became more “productive” (i.e. able to generate more value per hour worked), the breeders, influenced by your free market, would simply breed more of us.
We are in the Malthusian trap. We don’t keep the profits from our hard labor nor do we control when we have foals. Therefore, our welfare will fall until we reach subsistence levels.
This means that each time horse productivity changes, on a short enough timescale, the free market breeds more horses until the marginal horse is worth as much as before — our total opportunity cost to be kept as low as possible. By how much? This hinges on the price elasticity of demand - how large a change in quantity a 1% change in prices would cause. Racehorse demand is highly elastic at -2.35, and our own estimate for US horses in 1867–1914 is ‑5.26; we show both.6
Now seems like a good time to talk about what we mean when we say “welfare.” Welfare consists of:
Our total consumption (apples, sugar cubes, stablespace, silk ribbons),
How long and hard we had to work to get that consumption (how many hours spent pulling a carriage or heavy iron plough, building a windmill),
Our life expectancy, i.e. how long we have to enjoy the fruits of our labor, how healthy we are while we do, and how much of our free time we spend shut in a stall.7 8
We consider all of these factors when we say horse welfare in the 21st century is the highest it’s ever been, for each individual horse (which makes sense, pasturing is much easier than pulling) but, surprisingly, if the culling of horses hadn’t happened (i.e. population had stayed the same from the early 20th century), average welfare would be as high as in 1910, or higher.9
This is interesting because constructing this constant-population counterfactual would significantly reduce the wages and consumption of horses - but they still come out ahead or level.
Consumption
For the model, we measure horse consumption as what our keep costs at 2007 prices: it is 11% lower than in 1910, as better stables and a little more vet care are outweighed by fewer hours of human care.10 We assume we aren’t getting any nicer food — which is very conservative. In fact, I do enjoy better feed than my ancestors — quality hay twice daily, the occasional bran mash, and actual veterinary care when I’m ill — luxuries my great-grandsire could never imagine while chewing on moldy oats after fourteen hours of pulling streetcars.
Unlike the real world, in our hypothetical world where, more analogous to humans, the population hadn’t taken the “slack” for the loss of productivity (i.e. the marginal horse starved/was not worth keeping), the consumption of the horses did.11
Wages
Labour and capital combine for output. Initially, horses were the only source of labour — we worked ~9 hours a day on working days, about 940 hours a year, up to ~1900.12 Our bodies are enhanced by capital, such as ploughs and carriages, but try putting a plough in a field without a horse! Output would be 0 if you did not have both us and your tools for the set of tasks that any respectable 19th century horse would perform.
Starting from the invention of the motor car, and beginning in earnest with that wretched Model T in 1909, those noisy machines began to partially substitute for horse labour. They can do some tasks much better (though I still maintain they’re frightful on long journeys), some only slightly (have you ever seen a Model T prance elegantly for the Queen?), and some not at all. Not very many therapy cars out there, I see.
The idea is that wages are the product of the marginal return to labour, and the marginal returns to horse labour within labour. Initially, when you create a lot of cars, the marginal return to total labour will drop a lot.
After they figured out reliability, cars were strictly a better means of travel. Contemporaneous monitoring organizations like Mechanical Equine Transit Replacement (METR) projected the reliability over time.13 But eventually, as that the cars stopped encroaching on our task share, we will found our niche again - how many therapy cars have you ever encountered?
Life Expectancy and Work Hours
Our life expectancy has improved dramatically across America over the past 2 centuries. Consider this: where my great-granddam collapsed at age 7 after years of brutal city work, I can expect to live past 20.14 This matters tremendously—each additional year of life brings joy that doesn’t diminish like the pleasure of an extra apple or fancier blanket.
Meanwhile, our workload has virtually disappeared—from my ancestors’ backbreaking 9-hour plough days to my luxurious schedule of occasional light riding.15 To understand what this means for our welfare, economists try to calculate how much we horses value leisure versus work.
For humans, statistical value of life calculations 1 hour of work is worth about 0.88 hours of leisure—but let’s be honest, pulling a loaded coal cart uphill feels much worse than these figures based on air conditioned office jobs!16 Still, we’ll use conservative estimates: and assume we horses have a time preference discount rate of 2% (meaning we slightly prefer hay today over hay tomorrow), and our statistical value of life is 2.0.17 This means we highly value our longer, easier lives.
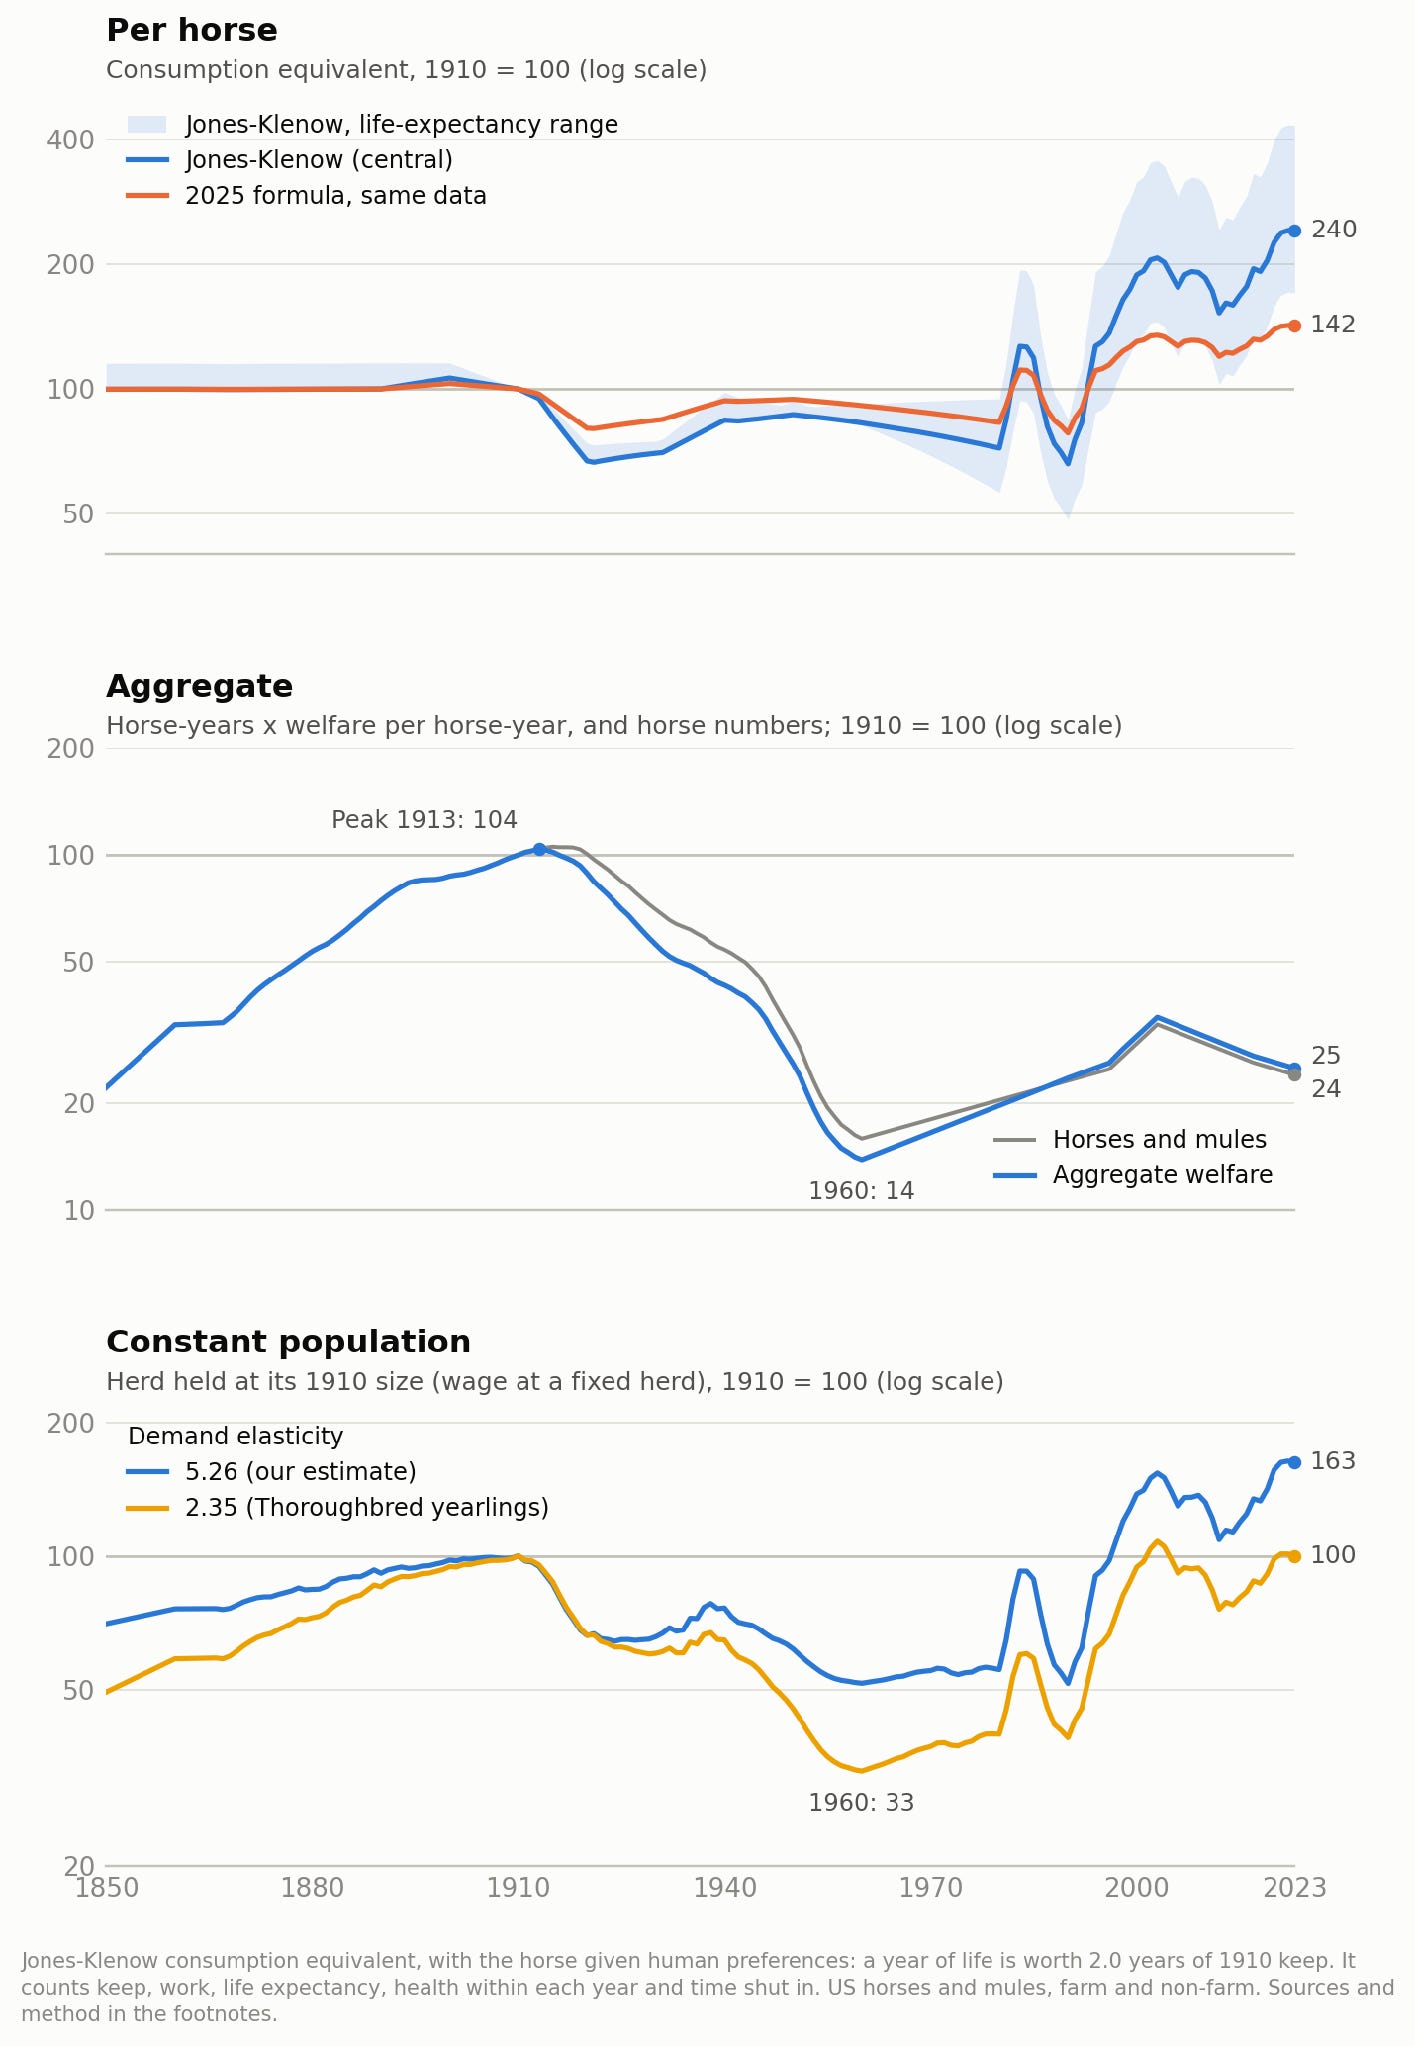
Welfare results by year are above. Horse welfare per horse rose, and at a constant population fell by much less than population, over the 1920-1960 period because it coincided with major growth in life expectancy. Today, the horse welfare index stands at 240 per horse and 100–163 at a constant population, compared to 100 in 1910, before the car.18 While any estimates here are necessarily quite imprecise, we can state with some confidence that the invention of the automobile was not catastrophic for our welfare.19
Conclusion
You humans now stand where my kind once did—at the precipice of replacement. Your “artificial intelligence” gallops toward you much as the automobile once thundered toward us. We each had no property, had no other members of our species who owned assets we could rely on to purchase our labour and had no power in the political process. And still outcomes for us were far from terrible, with welfare per horse only falling 38% from its peak (48–67% at a constant population) and recovering by around 2000.20
Unlike us horses, you own ourselves, and thus your wages, and you own tangible capital in the economy and control, somewhat, your own political process. By default, these may be sufficient to allow a rather better outcome for humanity than the reasonably good one we achieved for horses. With the development of superintelligence, you better hope that you can keep it that way.
US horses and mules, on and off farms, fell from 26.8 million in 1908 to 4.4 million in 1960 (−84%); farm animals alone fell 87%. Farm animals are USDA January counts (Historical Statistics of the United States, series K 564–582); animals off farms are census counts to 1920 (USDA Statistical Bulletin 5) and rough estimates after; numbers after 1960 are interpolated to American Horse Council estimates for 1996–2023.
The herd shrank mainly through fewer foals rather than more deaths: horse and mule colt crops ‘usually exceeded 2 million head’ in 1910–20 but were ‘less than 100,000 head’ by 1954 (Census of Agriculture 1954), while life expectancy rose in the 1920s and 1930s.
Welfare here is a Jones–Klenow (2016) consumption equivalent, with 1910 = 100: the multiple of a 1910 horse’s consumption that would leave it as well off as a horse in a given year, counting consumption, work, life expectancy, health and time shut in. Per horse it fell to 67 by 1921, has been above 100 since 1993, and was 188 in 2000 and 240 in 2023. Adjusting for population holds the herd at its 1910 size: at a demand elasticity of 2.35 welfare peaked at 108 in 2003, fell back to 76 in 2012 and is 100 in 2023; at our own estimate of 5.26 it is 163. Aggregate welfare sums each year’s welfare over the horses alive that year, so it counts life expectancy only through the number of horses: it peaked in 1913 and is 25 today. The 2025 post’s formula gives 142 per horse in 2023 on the same data.
This post was inspired by the realisation that all of Maxwell Tabarrok’s arguments in “What About the Horses” imply that horse wages should actually have grown in response to automation too, as horses are not perfect substitutes for cars, can absolutely use capital and other technology improvements over time and humans have preferences for horse produced goods even though horses don’t have the assets to buy horse-produced goods themselves.
The Bureau of Land Management estimated 68,928 wild horses on the land it manages on 1 March 2023 (BLM), about 1% of the 6.65 million horses in the US (American Horse Council).
2.35 comes from Thoroughbred yearling prices (Neibergs and Thalheimer 1997); 5.26 is our own instrumental-variables estimate from USDA horse numbers and prices for 1867–1914 (Historical Statistics of the United States), which is imprecise. The −0.98 in the first version, attributed to quarter horse data (Vestal et al. 2012), does not appear in that paper.
Worms and harness and saddle sores, priced with the human disability weights of the Global Burden of Disease (Salomon et al. 2015), took 4.9% of each 1910 horse-year and 0.2% of today’s. Of the Kentucky horses used in dewormer trials in 1956–83, mostly young and selected for large-strongyle infection, 84% carried the bloodworm Strongylus vulgaris (Tolliver et al. 1987); it has since all but vanished from managed herds in Kentucky (Nielsen et al. 2012). Heavy loads bring ‘lack of appetite, anemia, and progressive emaciation’ (USDA 1942), and worms were ‘particularly damaging to young, growing animals’ (USDA 1930), so farm horses under two carry the heavy-load weights. Counting health adds 15% to welfare per horse in 2023.
A 1910 farm horse was at pasture on about 99 days a year and otherwise spent most of its time off work in a standing stall, and city horses lived in stables (USDA Bulletin 560; Illinois Bulletin 238; FM-44). The average horse spent about 3,400 waking hours a year shut in, against about 1,300 today, when most horses are rarely confined (NAHMS 1998). Each such hour is charged like an hour of work, at 12% of a free hour; US surveys value ‘moderate problems in walking about’ at 0.122 (Pickard et al. 2019). The fall in time shut in adds 8% to welfare per horse in 2023.
With the herd held at its 1910 size, welfare per horse in 2023 is 100 at a demand elasticity of 2.35, the same as in 1910, and 163 at our own estimate of 5.26.
Keep per horse-year at 2007 prices: $2,291 in 1910 (feed $507; 126 hours of care, $1,306; stabling $179; shoeing, vet and sundries $300) and $2,041 today (the same feed; 90 hours of care, $939; stabling $271; shoeing and vet $324). The 1910 figures come from farm cost-accounting studies (USDA Bulletin 560). Today’s are an average over the ways horses are kept, weighted by the share of horses in each (NAHMS 2015), with care hours from stable-planning norms (LfL Bayern) and costs from extension budgets (University of Tennessee) and state surveys.
Here the herd stays at its 1910 size of 27.7 million, so each horse consumes the wage at which that many horses would be kept: the full yearly cost of a horse (its keep, extra feed for work, equipment and the cost of the horse itself) moved along a demand curve to the 1910 herd, at a demand elasticity of 2.35 or 5.26.
Farm work horses averaged about 940 hours of work a year in 1909–17, or 2.6 hours a day across the year, in five cost-accounting studies and a 1915 survey of 395 farms, from Illinois, Ohio, New York and Minnesota (USDA Bulletin 560; Minnesota Bulletin 179; Minnesota survey, 1915); a full day’s work was about 10 hours (USDA Bulletin 997).
At least once the Red Flag Act was repealed.
Life expectancy at birth was about 14 years in 1900–1910, from census counts of horses and young colts (Census of Agriculture 1959, Table 3), and is assumed the same back to 1850; it is about 20.5 today, from USDA death rates (NAHMS) plus slaughter and export (AWI). It dipped to about 12.5 around 1920 and to about 10.5 around 1990, when over 300,000 horses a year were slaughtered.
To be exact, average work hours were computed from farm records for work horses (about 940 hours a year before 1917 and about 760 in 1922–45; none for colts), about 1,250 hours a year for city horses (4 hours a day, 6 days a week) and about 100 for today’s recreational horses, and then weighting by the relative proportions of each horse type over time: 865 hours a year on average in 1910, against 100 today. A 2020 Pennsylvania survey implies roughly 80–93 hours a year across all horses, including the 40% not exercised (Orr et al. 2021).
The US has a statistical value of life of $240k/annum, or about $40 per waking hour. Average wages are $35/hour, implying that living and working is 88% as good as leisure. Note that this figure was presumably lower in the past when work was much more manual and arduous than today.
A year of life is worth 2.0 years of a 1910 horse’s consumption. It is derived rather than assumed, by giving horses human preferences: Jones and Klenow’s (2016) calibration of human welfare (log utility, matched to a $6 million value of a statistical life in 2007), evaluated at the 1910 horse’s keep, which cost 5.8% of US consumption per person at 2007 prices, less the cost of its work and time shut in. The 2025 post assumed 2.5.
From 1920 to 1960 horses and mules fell 84%; welfare per horse rose 24%, and with the herd held at its 1910 size it fell 22% at a demand elasticity of 5.26 and 51% at 2.35. Life expectancy at birth rose from about 12.5 to 14.6 years, though the 1960 figure is poorly identified: at 12 years welfare per horse changes by −7% over the period, at 17 by +58%. Aggregate welfare fell with the herd, by 84%. In 2023 welfare per horse is 240, and with the herd held at its 1910 size it is 100 at 2.35 and 163 at 5.26 (1910 = 100 throughout).
Indeed, we horses arguably fared much better than many of our non-human competitors like chickens or pigs.
Per horse: 106 at the 1900 peak, 66 at the 1990 low, above 100 since 1993 and 240 in 2023. With the herd held at its 1910 size, from 100 in 1910: lows of 52 at a demand elasticity of 5.26 and 33 at 2.35; back above 100 by 1997 at 5.26, and by 2002 at 2.35, though at 2.35 it fell back to 76 in 2012 and is 100 today. Aggregate welfare fell 87%, from 104 in 1913 to 14 in 1960, and is 25 today.
What are the sources for the horse population, life expectancy, or daily labor numbers? None of the links seem to cover them.
> Not very many therapy cars out there, I see.
Oh, they're all around you: note the Ferrari logo. (It's just that Lamborghini, BMW, Tesla, Ford et al don't market things like the F150 or Cybertruck as 'therapy cars'.) Horses don't make very good therapy horses compared to the iron horses, turns out.