
Sowing The Wind
The implicit shadow price of carbon in the UK

Electricity in Britain is ruinously expensive. Household prices have risen 2.5 times faster than inflation since 2010, to twice the American level. Gas prices have returned to where they were before the invasion of Ukraine; electricity prices have not - and if the cost of gas fell by 90%, household bills in 2030 would still be higher than they are today.
The cause is not gas. It is the cost of renewable energy policy.
Consumers pay for renewables three times over: first through direct carbon taxes on gas-fired generation, then through guaranteed above-market prices for wind and solar under Contracts for Difference (CfDs), and finally through a growing stack of levies for the backup capacity, grid reinforcement, and balancing services that intermittent generation requires. Together these impose an implicit carbon price of £342 per tonne on British electricity — more than double the £154/t that the academic literature estimates would maximise global welfare.
The consequences extend well beyond the bill. Household electricity costs at £911/annum today are scheduled to rise to £1,045/annum by 2030; on an all-gas grid with globally optimal carbon pricing they would be £689/annum, and with nationally optimal carbon pricing £506/annum. The overtaxation suppresses GDP by 1.0-1.8%, manufacturing output by 2.4-4.5%, and energy-intensive industries - steel, chemicals, cement - by 4.7-8.7%.
The most important step is to stop making the problem worse: have no further renewable auction rounds and commit to no further renewable construction until costs fall substantially. For the legacy of existing contracts, the government can either let them expire - yielding bill reductions of roughly £100 per household every five years - or assume the sunk costs onto general taxation immediately, lowering bills by 24-44% at a declining fiscal cost that turns net positive within a decade.
Twice shadow price
The stated purpose of renewable energy policy is almost entirely environmental: we favour wind and solar over gas because they emit less carbon. A subsidy to one megawatt-hour of renewable generation is therefore the mirror image of a tax on one megawatt-hour of gas — and the total implicit carbon price is the sum of both direct taxation and renewable subsidies, regardless of whether these are levied through bills or general taxation. Bills are high because the costs of these policies currently fall on electricity consumers, but the underlying policy choice would be equally expensive however it was funded.
The direct taxes on carbon are modest. The UK ETS charges £42 per tonne of CO2, supplemented by £18 from the Carbon Price Support, for a combined £60/t — unremarkable by European standards.1 But this barely scratches the surface of what the policy actually costs.
The primary subsidy mechanism is the CfD: a guarantee that a renewable generator will be paid a fixed price (known as a strike price) for every unit of electricity it produces, regardless of the wholesale market price.2 These contracts are awarded through competitive auctions known as allocation rounds. The seventh and most recent, AR7, concluded in early 2026, awarding 14.7 GW of capacity at strike prices of £91/MWh for offshore wind, £72/MWh for onshore wind, and £65/MWh for solar (2024 prices) - locked in for twenty years from construction until 2049. The implicit subsidy has three components.
First, strike prices are set above the average market price - the direct, visible payment from consumers to generators. Second, renewable output is highly correlated - wind farms generate at the same time as each other (output correlations well above 0.3), and every solar panel shares the same sun - so the wholesale price at the moment CfD payments are triggered (the “capture price”) is systematically lower than the average wholesale price. The ratio of the two, the capture rate, measures how much of the headline market price a renewable generator actually displaces. Third, and most importantly, every new megawatt of renewable capacity is subject to the same correlations so lowers the capture rate of all existing renewable capacity, cannibalising it. In most markets cannibalisation would merely impose losses on competing firms. Under CfDs it translates directly to higher consumer bills, because every generator is guaranteed its strike price regardless. We are very much carrying coals to Newcastle: building capacity that generates electricity precisely when we already have too much of it. If the wholesale price averages £70 but wind generates disproportionately when it’s £64, the capture price is £64 and the capture rate is 92%. The CfD pays the difference between the strike price and the capture price - so when the capture rate falls from 92% to 77%, the subsidy from consumer bills widens by £10/MWh.
Current CfD payments already reflect this: offshore wind receives subsidies roughly £90/MWh above wholesale, onshore wind and solar roughly £50/MWh, versus wholesale for gas excluding carbon pricing of £78/MWh. But these figures blend very expensive early contracts with a tranche from the late 2010s that cleared cheaply due to systematic underestimation of maintenance costs - and both effects are swamped by what is coming. The capture rate, currently 92%, will fall precipitously as new capacity enters the grid, mechanically widening the gap between strike prices and capture prices on every existing contract.
To project the subsidy forward, I use Ben James’s projections for wholesale prices and capture rates: £84/MWh wholesale and 92% capture today, falling to £70/MWh and 77% by 2030 and £60/MWh and 65% by 2040, held flat thereafter.3 Subsidies are calculated as the difference between payment and realised market price, plus cannibalisation of existing capacity.

These CfD subsidies — £81/MWh for offshore wind, £61/MWh for onshore wind, £37/MWh for solar — are large. But they capture only the direct payments to generators. The costs of intermittency itself are separate, and they are borne by consumers through an entirely different set of charges.
Intermittent generation requires backup capacity to keep the lights on when the wind drops. The Capacity Market — negligible in 2010 — will cost £3.6bn in 2027–28, equivalent to £22/MWh of renewable output. It also requires extensive balancing: curtailment (paying wind farms to switch off when output exceeds demand), frequency response, reserves, and the infrastructure to restart the grid after a total failure. Balancing costs have risen from £1.1bn in 2010 to £2.7bn today (both in 2025 prices), worth £19/MWh across 144 TWh of renewable generation, and are projected to rise a further 120% by 2030 — partly reflecting inadequate transmission capacity, but structural even after planned upgrades. That transmission is itself a further cost: because wind and solar have low capacity factors, they require far more grid infrastructure per unit of average output than firm generation. The government estimates transmission adds £14/MWh for offshore wind, £10/MWh for onshore wind, and £1/MWh for solar.4
The government also holds enabling powers under the Energy Act 2023 for a Gas Shipper Obligation - a levy on gas suppliers to fund hydrogen production subsidies - which at stated ambitions could substantially increase bills, but as rates have not yet been set these costs are not considered here.5
Aggregating all non-wholesale system costs, the government’s own estimates come to £71/MWh for offshore wind, £69/MWh for onshore wind, and £65/MWh for solar. These costs are currently socialised equally across all electricity consumers rather than attributed to the renewables that cause them. Correcting for this cross-subsidy - non-renewable generation was 60% of output in 2025 - gives effective cost gaps of £43/MWh, £41/MWh, and £39/MWh.6 Learning curve arguments - the price of renewables falling as we build more of them as we get better at their production - do not reduce these figures for a country installing less than 1% of global solar and onshore wind capacity.7
Combining the CfD subsidy, the system cost gap, and the direct carbon price gives the total cost per MWh of displacing gas with renewables. For new offshore wind at projected carbon prices: £81 + £38 + £70 = £189/MWh. For new solar: £37 + £34 + £70 = £141/MWh. At current tax rates the figures are £141/MWh and £94/MWh respectively. The wholesale cost of gas-fired electricity, excluding any carbon price, is £67/MWh.
To convert these cost premiums into an implicit carbon price, we need the emissions each MWh of renewables actually displaces. As a baseline, the IPCC estimates that new gas capacity emits 370 gCO₂/kWh directly plus 91 gCO₂/kWh from methane leakage. Emissions savings will be less than this for two reasons. First, gas plants forced to cycle up and down to accommodate intermittent renewables run less efficiently than they would at steady high load. A modern CCGT achieves 56-57% thermal efficiency at design point but only 51–52% at the reduced load factors - now averaging 30–40% - that the current grid imposes.8 This 5–6 percentage point gap adds roughly 40–45 gCO₂ to each MWh of gas generation currently, and would be removed in a primary gas grid. Allocated across renewable output at current penetration (47% renewable), this reduces the effective CO₂ displacement by about 10%.9 Second, renewables themselves have lifecycle infrastructure emissions: 15–17 gCO₂/kWh for wind, 66 gCO₂/kWh for utility solar, per the IPCC.
Netting these adjustments gives effective displacement of 416 gCO2/kWh for wind and 366 gCO2/kWh for solar, and therefore an implicit carbon price of £355/tCO2 for offshore wind and £270/tCO2 for solar at current tax rates — or £475/t and £408/t respectively at projected carbon prices for new capacity. Weighting by 2024 output (83 TWh wind, 14 TWh solar) gives a blended implicit carbon price of £342/tCO2 at current rates and £465/tCO2 at projected rates.
These figures are more than double the academic consensus on the globally optimal carbon price. The standard tool for estimating what carbon should cost is the Integrated Assessment Model: an economic simulation combining a climate model (how much warming does a tonne of CO2 cause?) with a damage function (how much does that warming reduce economic output?). The model finds the price at which the marginal cost of abatement equals the marginal damage avoided - the “social cost of carbon.” The result depends heavily on the discount rate, since climate damages fall mostly on future generations: at the low rates favoured by Stern, Rennert et al. (2022) - the largest recent meta-analysis - gives £154/tCO2 in 2025 prices. Resource-extraction models that instead price the atmosphere as a depletable stock converge on a similar figure.10
Importantly, this is the globally optimal price: the price at which the world as a whole is made better off. For a country responsible for 1% of global emissions, the nationally optimal price is far lower: Britain bears the full cost of abatement but captures only ~4% (share of global GDP) of the climate benefit, and is colder than average, hence less exposed to the damages of warming. In practice the nationally optimal carbon price is thus below £6/t, essentially zero as above administrative costs of any realistic implementation and hence assumed as such throughout.
British electricity policy thus prices carbon at £342/t - 2.2 times the globally optimal level, and many multiples of a nationally optimal price that is essentially zero.
All gas grid
It is worth stressing that these implicit carbon prices do not represent windfall profits for renewable generators - they are the minimum prices necessary to induce construction to the government’s desired levels. Absent such subsidies, renewables would not be built and the grid would be primarily gas-fired. We therefore model two counterfactual cases: one with globally optimal carbon pricing at £150/t, and one with nationally optimal carbon pricing.11 12
Gaslight
But aren’t renewables cheaper than gas at the government’s levelised cost estimates, with offshore wind at £39/MWh against gas at £139/MWh (£2025)? Both figures are misleading. The gas number includes £83/MWh of carbon costs at target-consistent appraisal prices - not the £22/MWh that generators actually pay under the UK ETS and CPS currently, but a trajectory averaging £224/tCO2 over the plant’s lifetime, reverse-engineered from the desired future emissions path. Strip this back to current carbon taxes and gas costs £78/MWh. The wind number, meanwhile, is what it costs the developer to build and run the turbine - not what it costs the consumer. The consumer pays the CfD strike price (at AR7 £91/MWh for offshore wind, £72/MWh onshore, £65 solar), plus the system cost cross-subsidies (capacity market, balancing, transmission) that DESNZ’s own report acknowledges it excludes (£71/MWh for offshore wind), plus the cannibalization costs as correlated output depresses the capture price on every existing contract (£30/MWh for wind). Even before accounting for the capture rate - which mechanically widens every one of these gaps as more capacity enters the grid - the comparison inverts at present, with offshore wind at £195/MWh, onshore wind at £171/MWh and solar at £152/MWh for a blended renewable average of £183/MWh vs gas at £78/MWh - over twice as much. Renewables are not cheap power carrying expensive subsidies. They are expensive power whose costs are hidden by an accounting framework that loads phantom carbon taxes onto the alternative.

The true counterfactual bill is built line by line from observable data. The wholesale cost of gas-fired electricity is £108/MWh at £150/t carbon or £55/MWh without, derived from DESNZ generation cost assumptions at 93% load factor and 57% LHV efficiency. All renewable subsidies (RO, FiT, CfD, Capacity Market) and green levies (ECO, WHD, NCC) are removed. Network charges - TNUoS, BSUoS, and DUoS - are set to their inflation-adjusted pre-renewables baselines, with the excess attributed to renewable integration.13 Nuclear (Sizewell C RAB at £12/household) is retained as nuclear may have other energy security advantages, and the contracts are signed regardless. Gas strategic storage at 19.5 bcm - six months of electricity-dedicated supply, compared to the UK’s current seven days of peak demand - is added. Supplier costs and the smart meter levy are held at their inflation-adjusted baselines, which closely match current levels.

Over 80% of the saving comes from removing directly observable subsidies and levies - line items in the Ofgem price cap that require no estimation. The network excess over baseline (£59) is secondary, and likely understated since the baseline periods already included some renewable integration costs. The only line that costs money in the counterfactual is wholesale electricity, because pricing carbon at £150/t roughly triples the current UK ETS rate. At zero carbon pricing, even this disappears.
Electricity bills would thus be 24% (£222) lower than today, and 34% (£356) below their projected 2030 level, under an all-gas grid with globally optimal carbon pricing. At the nationally optimal carbon price, bills would fall by 44% (£405) relative to today and by 52% (£539) relative to 2030.
Oil in the lamp
Gas does have one major drawback: supply is interruptible. 43% of the UK’s gas consumption arrives through pipelines from Norway - infrastructure that can be severed by a small team in a yacht, let alone any more capable platform. Prediction markets give roughly 21% probability of a war between Russia and one or more NATO countries by 2035.14 The UK currently has just 7 days of gas storage at peak winter demand, compared to 89 days for Germany, 103 for France, and 123 for the Netherlands. NESO’s own gas security assessment found that if any single major piece of gas infrastructure were lost - one pipeline, one terminal - supply would be unable to meet peak winter demand by 2030/31 under any scenario it modelled, and the government’s emergency planning acknowledges that in a gas deficit emergency the resulting surge in electric heating demand could overload and collapse the electricity grid in turn. The vulnerability is real - this would, however, be cheap to fix. Assuming gas covers 80% of the grid, or around 240 TWh, six months of storage - 19.5 bcm, fungible to household heating in a winter crisis - would cost £11 per household per year, well under 2% of the average energy bill.15 16 17
Dark Satanic Bills
To translate high electricity prices into a cost on GDP, we use the electricity price elasticity of output: the percentage change in output caused by a one percent change in electricity prices. Estimates in the literature range from 0.03 to 0.37, but this wide spread is largely explained by sectoral coverage. Manufacturing is far more electricity-intensive than services, so studies focused on manufacturing find much larger elasticities than those covering the whole economy. Since UK manufacturing is roughly 10% of GDP, the whole-economy elasticity must be at least a tenth of the manufacturing-only figure - and somewhat more in practice, because the UK uses as much electricity for commercial purposes as industrial.
At the low end, Bijnens et al. (2021), calibrated on European data and recalibrated to ONS input-output tables with five-year capital adjustment, give a whole-economy elasticity of 0.031. US manufacturing studies cluster higher: Wolverton, Shadbegian and Gray (2022) find 0.081 for full manufacturing and 0.158 for energy-intensive industries; Casey et al (2020) find 0.2, though explicitly short-run. Marin and Vona (2017) estimate separate French elasticities of −0.26 for employment, −0.04 for average wage, −0.11 for value added per worker, and −0.12 for TFP; compositing via employment + value added gives roughly 0.37, as does applying the Wolverton et al. employment-to-output multiplier. UK manufacturing is 10% of GDP, hence the above studies imply the whole economy elasticity should be at least one tenth of the manufacturing only share. As the UK uses as much electricity for commercial as industrial purposes, an output elasticity equal to twice this is not unreasonable. The UK figure should also sit above US estimates: the impact of electricity on output scales with the Domar weight, and the UK spends roughly 1.6x as much on industrial electricity as the US as a share of GDP, and 1.2x that of France.18 Most of the above studies run on 1–5 year horizons, insufficient for full capital stock adjustment. An output elasticity of 0.04 is accordingly favoured, although this could be higher in practice.
However, electricity expenditure is only 2-2.5% of UK GDP, so why would a price reduction deliver growth larger than this share?19 The answer is that electricity is not just a final input like office paper - it is an operating cost of every machine, furnace and production line in the economy. When electricity is expensive, capital equipment is expensive to run, and firms deploy less of it. But the less capital an economy has, the more productive each additional unit of it is: the first crane on a building site adds far more output than the fifth. The UK, in common with most Western economies, operates well below its optimal capital stock according to standard models, which means we are stuck in the steep part of the curve where each machine that becomes viable to run produces substantially more than its operating cost. Cheaper electricity doesn’t just save money on the power bill - it makes a tranche of currently marginal capital equipment worth building, and the output from that equipment is many times larger than the energy saving alone.
The 24% (44%) cost reduction above would thus imply a boost to GDP of 1.0% (1.8%), or £28bn (£50bn)/annum. At the Wolverton, Shadbegian and Gray (2022) estimates adjusted by 25% to account for Domar weight differences, manufacturing output generally would grow by 2.4% (4.5%), and specifically energy intensive industries (steel, chemicals, cement, glass) would grow by 4.7% (8.7%).
Policy & transition dynamics
Renewables and their infrastructure are sunk costs. The government is contractually bound to pay generators for the next several decades, and these obligations cannot be wished away. But provided no further renewables are built, these sunk costs do not change the marginal cost of producing electricity - which is determined by gas, as this would be our source of electricity at the margin. Whether the legacy payments sit on electricity bills or on general taxation, the same power stations produce the same electricity at the same cost. The only question is whether consumers and businesses are also charged for historical policy decisions on top of that marginal cost, or whether the Treasury absorbs them.
The simplest policy - and the one requiring no fiscal commitment - is to stop making the problem worse. Committing to no further CfD rounds is immediately fiscally positive: output and tax revenues grow at no cost to the state. The loss of UK ETS and CPS revenue under a zero carbon price is almost exactly offset by removing the reduced VAT rate on residential electricity (currently 5% vs the standard 20%), which could be done while still greatly lowering household bills. As existing contracts expire, bills fall by roughly £100 per household every five years - a substantial improvement requiring no new spending and no political risk.
Should the government go further and assume the legacy costs immediately? There are two arguments for doing so. First, economically, the correct price of electricity is its marginal cost; loading sunk policy costs onto bills distorts every consumption and investment decision in the economy, and taxation has an increasing marginal cost per product so slightly distorting all product prices slightly more with higher general taxation is efficiency enhancing compared to distorting one product greatly. Second, for businesses, electricity is an input into virtually everything the economy produces, and the fundamental insight of optimal tax theory - Diamond and Mirrlees (1971) - is that taxing production inputs is strictly worse than taxing final goods or income, because it distorts not just how much firms produce but how they produce it.
In the absence of competing demands on fiscal space, the costs should therefore sit on general taxation - not as a subsidy to electricity consumers, but as the removal of an unusually destructive form of revenue-raising. Three revenue sources partially offset the fiscal cost: the government captures carbon tax revenue currently dissipated to renewable generators, VAT harmonisation (replacing the 5% reduced rate with the standard 20%, which can be done while still lowering bills), and higher tax receipts from the output growth that cheaper electricity enables.
To quantify these dynamics we model two packages — one with a globally welfare-maximising carbon price of £150/tCO₂ (5% VAT retained) and one with zero carbon pricing (VAT harmonised to 20%) — each against a “wait” counterfactual in which the same carbon and VAT settings are adopted but legacy costs remain on consumer bills. The subsidy schedule is built from actual CfD contract data by auction round (LCCC strike prices, capacities, and contract lengths; generation and wholesale price forecasts from Ben James’s electricitybills.uk), plus RO, FiT, and Capacity Market obligations. Bills in the wait scenarios decline as each tranche expires on its known schedule, with network costs declining according to the RAB depreciation schedule. Under the wait-with-carbon scenario, the carbon price phases in as subsidy headroom permits, constrained so that bills never exceed their projected 2030 level. GDP is assumed to grow at 1.5% per annum (OBR medium-term potential output) and electricity demand at the same rate, reflecting electric vehicle adoption and data centre growth independently of climate policy (NESO FES 2025). Output effects are phased over five years; tax revenue is taken at the tax share of GDP, 37%. All present values use the Green Book discount rate of 3.5%.

The initial net cost is £16–20bn per year depending on carbon pricing assumptions, falling as contracts expire. Breakeven on an annual cash-flow basis arrives by 2031 (without carbon pricing) or 2035 (with), and the proposal is net positive in present value terms by 2040 and 2045 respectively.
However, fiscalisation competes with other uses of scarce fiscal space. The UK tax system contains several marginal tax rate cliffs; fixing these may buy more output per pound. And any future government that resumed renewable construction would transform a temporary fiscal bridge into a permanent subsidy, destroying the economic logic entirely - the sunk-cost argument depends completely on the costs remaining sunk.
The more conservative path - cancel AR7, let existing contracts expire, and direct the growing fiscal space toward the most binding distortions elsewhere - is therefore likely more prudent. Even without action, bills will fall at a substantial rate over the next few years after 2030 if the bleeding can be stopped, at around £100 every 5 years. The critical point is that the choice of transition mechanism does not affect the core finding: the implicit carbon price is £342/t, bills are far too high, and no further renewable capacity should be built at anything resembling current costs.
Let them eat carbon
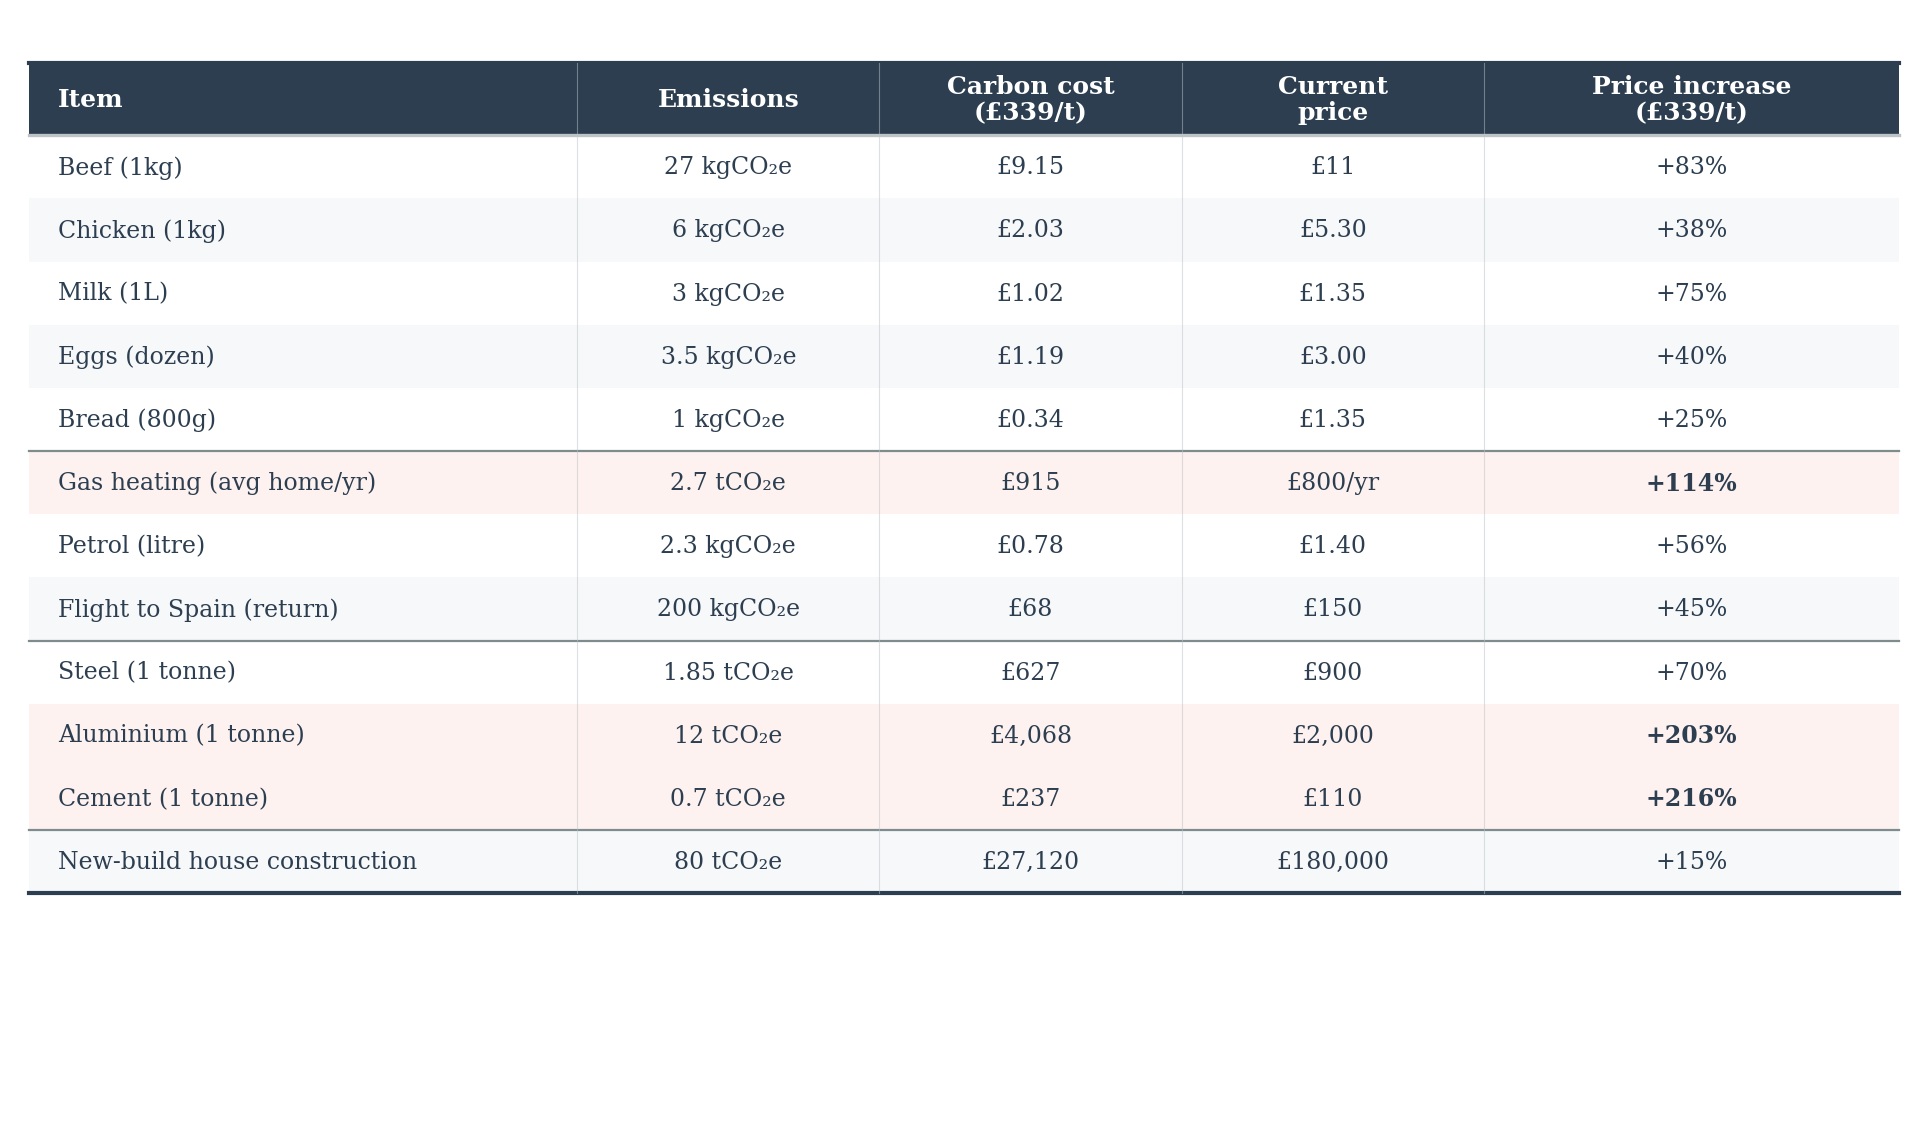
The implicit carbon price in the UK energy system is £342 per tonne. It is unsurprising that energy is so expensive: the table above shows what this price would mean if applied to the rest of the economy. Beef prices would almost double. Heating bills would increase more than twofold. The cost of building a house would rise by 15%. Electricity is the one sector where something approaching this level has actually been implemented - and the result is prices nearly four times the US industrial level and a manufacturing sector in accelerating decline.
Restoring effective carbon prices to globally welfare-maximising levels would lower consumer bills by 24% and raise GDP by 1.0%. Moving to a nationally optimal carbon price would lower bills by 44% and raise GDP by 1.8%. The most important immediate step - cancelling AR7 and building no further renewables at anything resembling current costs - requires no fiscal commitment at all.
But electricity is not an aberration. It is a preview. The Climate Change Act requires net zero emissions by 2050, and the government’s own modelling relies on what it calls “target-consistent” carbon prices to get there. These are not estimates of the damage carbon causes - they are not derived from any model of costs and benefits at all. They are simply the prices reverse-engineered from the emissions path the target requires: whatever carbon must cost to force behaviour to change enough to hit net zero, that is the price, regardless of whether the change is worth making. This stands at £333/t today (2025 prices), rising to £485/t by 2050 - figures published by the government as the carbon prices its modelling says are required to meet the Act’s statutory targets.20 They are not yet applied economy-wide, which is precisely why the rest of the economy has not yet suffered what electricity consumers have. But the Act’s targets remain law, and if they are to be met, these prices must eventually reach every sector: heating, transport, agriculture, construction, industry. The government is candid about the disconnect: the relevant DESNZ guidance states that social cost of carbon analyses are “not aligned with the net zero target, [with] most estimations lead[ing] to emissions levels much higher than net zero in 2050.” The target was chosen first; the economics were discarded afterward.
The future of the Climate Change Act as written is the extension of our energy poverty to the whole economy.
Government planning documents for new generating capacity assume a much higher effective carbon price — around £175/t — because they treat direct carbon taxes as the sole environmental cost and therefore project them rising steeply to reach target-consistent levels. This can create the misleading impression that new gas capacity is more expensive than it actually is at current tax rates. The £175/t figure is what the government believes carbon taxes will average over the lifetime of the plant at expected growth rates, not what they are.
CfDs also obligate generators to pay back should the market price exceed the strike price, but this rarely occurs in practice.
Why hold the capture rate flat after 2040? Some models project it recovering as demand becomes more flexible through hydrogen electrolysis, vehicle-to-grid arbitrage, and heat pump load-shifting. But the requisite deployments depend on policy targets that are not being met: the EU has less than a tenth of its target hydrogen electrolyser capacity, the UK gas boiler ban was delayed from 2025 to 2035 and then abandoned entirely, and the EU’s 2035 ICE ban is being replaced by rules permitting a 90% reduction. Holding the capture rate flat is therefore conservative - it very likely continues to fall.
Inertia - the angular momentum of spinning turbines that smooths small frequency fluctuations - must also be replaced synthetically as the grid decarbonises. The capital cost is roughly £2bn, equivalent to ~30p/MWh in present value terms assuming 5% annual depreciation. This is negligible relative to the other system costs and is not included in the totals above.
At current scale (HAR1, 125 MW, ~£150m/year) the GSO adds £2.60–4.50 to the average bill. But the government’s stated ambition of 10 GW of low-carbon hydrogen would by Onward’s estimates cost £53bn over 15 years, implying household costs over two orders of magnitude higher. The enabling powers in the Energy Act 2023 allow the GSO to scale without further primary legislation.
Formally: if renewable generation has share p and system cost premium x, the current pricing regime spreads the cost equally, charging everyone 1+px rather than charging renewables 1+x. The true cost gap is therefore x(1−p), which is what would be added to non-renewable bills if costs were correctly attributed. One might object that the renewable fraction will grow over time, reducing the non-renewable share and hence the cross-subsidy. This is irrelevant because the above formula estimates the true subsidy level from observed prices today, correcting for the fact that some of the cost of the cross-subsidy remain incident on renewables. The underlying cost differential is unvarying in numbers in this model - this is merely the estimator to calculate them.
Learning curves are sometimes cited as a motivation to overpurchase renewables: since we have invested far longer in fossil fuel infrastructure, an additional unit of renewable expenditure yields more learning-by-doing, and investment decisions should be adjusted accordingly. But the UK installs less than 1% of global solar and onshore wind capacity — far too little to move the global cost curve. For offshore wind the UK share is 15–20%, but offshore wind learning curves are much shallower than solar, it is the furthest from cost-competitiveness of the three technologies, and it is unclear whether the relevant learning curve is offshore-specific or all wind - the latter implying much lower marginal returns from UK deployment since total wind capacity is not significantly moved by British installations alone.
The DESNZ Electricity Generation Costs 2023 report confirms CCGT load factors in the 30–40% range, though individual plant-level analysis by Ed Hezlet using NESO data shows wide dispersion across the 29 operational CCGTs. The fleet-average efficiency trend is flat over time, though this is explained by ongoing fleet renewal offsetting the degradation from lower utilisation.
This estimate is conservative. The UKERC review (Gross et al.) found efficiency penalties of up to 7% at penetrations of only 20%; Katzenstein & Apt (2009) found wind-gas systems in Texas achieved only 76–79% of expected CO₂ reductions; a Spanish grid study found a 20% penalty at 50% penetration. A 2025 Nature Communications study using hourly data from California and Texas found wind and solar achieved 91–93% of expected reductions under normal conditions but that inefficient thermal operation could raise gas emissions by 12–26%. The UK figure sits at the low end because operators have adapted to cycling by adopting binary run-or-shutdown strategies rather than lingering at inefficient part-load - compressing the efficiency penalty but shifting costs into start counts and maintenance that appear elsewhere in the system cost stack - but the above studies are mostly older hence system integration was worse. This also excludes OCGT substitution effects (the UK has ~2.4 GW of OCGT capacity emitting ~50% more CO₂/kWh than CCGTs), which would slightly raise the figures.
Burke, Byrnes and Fankhauser (2019) find approximately £150/tCO₂ using a Hotelling model in which the carbon price equals the discounted future cost of direct air capture plus interim holding damages.
We assume 3,100 kWh/year typical domestic consumption (GB-weighted average, per Ofgem price cap methodology). “Current” refers to FY 2024–25 from electricitybills.uk; “2030” to FY 2030–31 from Ben James, 2030 Outlook — GB electricity bills (real 2025 prices). All counterfactual figures are inflation-adjusted using the HM Treasury GDP deflator (ONS series L8GG). Gas prices are set at DESNZ’s 2023 central projection of 72p/therm; at near-term forward prices of 80p/therm the counterfactual bill rises by £17, and at BEIS (2019)’s long-run central estimate of 64p/therm it falls by £17. The UK’s incremental gas demand under an all-gas grid — roughly 33 bcm — represents less than 1% of global gas consumption, arriving into a market where 300 bcm of new LNG export capacity is under construction. Standard elasticity estimates imply a long-run price impact of 1–2%, or roughly £2–5 per household.
Gas CCGTs emit ~0.3 kg NOx/MWh with modern dry low-NOx burners. At DEFRA’s damage cost of £4,000/t, this adds £1.20/MWh or ~£4/household — under 2% of the counterfactual saving. SO2 and PM2.5 emissions from gas CCGTs, unlike coal, are negligible. A gap between UK and EU carbon prices would also trigger the EU’s Carbon Border Adjustment Mechanism (CBAM), but this is of trivial scale: CBAM covers only six sectors, UK CBAM-liable exports to the EU total approximately £7bn, and the implied gross annual cost is at most £125–175m before credit for any UK carbon prices already paid — a rounding error against the domestic costs discussed above.
TNUoS is set to its 2010 inflation-adjusted level of £32/household (current: £40, but projected to reach £133 by FY30-31 as offshore wind HVDC links and north-south reinforcement come online — Ofgem RIIO-T2 attributes over 60% of this to renewables). BSUoS is set to its 2010 baseline of £7/household; the current £32 reflects the clearest renewable-driven cost in the system, with curtailment alone costing £1.1bn in 2023-24 against zero in 2010. DUoS is set to its FY15-16 baseline of £112/household — the earliest year with reliable Ofgem-methodology data, itself already including some embedded generation management costs.
Depleted reservoir storage costs approximately $5–6m per billion cubic feet of working gas capacity. At 19.5 bcm (689 bcf) this gives a US onshore baseline of £2.8–3.3bn. Cross-check: Centrica purchased Rough (~3 bcm) for £304m in 2002 (~£500m in 2025 prices, or ~£170m/bcm); scaling linearly to 19.5 bcm gives £3.3bn, consistent with the higher end. Centrica later reopened Rough for under £10m and generated £653m operating profit between 2022 and 2024. Annualised at the Green Book 3.5% real discount rate over 40 years (capital recovery factor ~4.7%) plus operating costs of 1.5–2.5% of capital, the working gas inventory (~19.5 bcm at 72p/therm ≈ £5bn) and cushion gas (~50% retained in situ in depleted fields) are financeable assets rotated on a multi-year cycle; annual financing and rotation costs. Total: £250–400m/year, or mean £11 per household across 28.5m households per year. The UKCS contains multiple depleted fields suitable for conversion, with ~5 bcm already holding planning permission. Combined with Rough’s ~1.5 bcm, reaching 19.5 bcm requires converting several additional fields — a significant but proven programme using mature, globally dominant technology (depleted-field storage accounts for 80% of global gas storage capacity).
Why not dual-fuel the turbines with oil instead, as Ireland and New England do? The stored gas is also fungible to other gas uses. In a winter crisis where heating demand surges, gas earmarked for electricity can be redirected to keep homes warm - or vice versa. A separate kerosene or diesel reserve for dual-fuel turbines stored in salt caverns would be unlikely to be much cheaper per month of electricity coverage but could never be redirected to the 23 million UK households with gas boilers.
For comparison, Germany maintains 23 bcm of storage and France 13 bcm. The proposed UK reserve of 19.5 bcm would place Britain in the middle of its European peers — a position it has not occupied since the closure of the Rough facility in 2017.
For the UK: non-domestic electricity consumption was approximately 150 TWh in 2023 (DUKES 2025 Ch. 5) at an average non-domestic price of 24.3p/kWh (DESNZ QEP September 2025), giving expenditure of ~£36bn against GDP of £2,275bn, or ~1.6%. For the US: non-domestic consumption was approximately 2,430 TWh in 2024 (EIA) at a blended industrial/commercial price of ~11.5c/kWh (EIA Electric Power Monthly), giving ~$279bn against GDP of ~$28,300bn, or ~1.0%. For France: non-domestic consumption was approximately 245 TWh at a blended price of ~16c€/kWh (Eurostat via DESNZ QEP December 2024), giving ~€39bn against GDP of ~€2,800bn, or ~1.4%. The UK Domar weight is thus roughly 1.6x the US and 1.15x France.
The 2% figure comes from 2019 and 2020; the 2.5% from the height of the energy crisis in 2022-2023, both derived from the ONS input output tables. The following argument relies on Baquee and Malmberg (2025), who find that the impact of a productivity shock on electrical equipment production in the US would likely raise output by 2.24x as much as the expenditure share would suggest.
The closeness of these figures with the above implicit carbon price estimate is striking but should not be overread into necessarily assuming that energy’s implicit carbon price was set explicitly to align prices to this rather than to desired quantities of renewable energy. DESNZ’s own uncertainty range on the target-consistent carbon values spans 50% around the central estimate, and the administrative strike prices at which CfD auctions actually clear have historically diverged significantly from departmental expectations - the AR6 round famously attracted zero offshore wind bids at the published ASP, while the roof for bids for offshore wind at AR7 was £113/MWh, £21/MWh above the eventual clearing price. My implicit carbon price estimate likewise carries uncertainty of tens of pounds per tonne, driven by assumptions on system costs, cannibalization, and the counterfactual wholesale price.
First rate, many thanks!
Bravo Duncan. This is a very impressive piece of work.
The detail is important, even if it is hard going (for me at least) to process. The overall picture makes total sense. We can see the intermittency, grid costs, impact on running gas plant inefficiently etc.
The figures for Ireland are likely to be even more challenging. The current "plan" even includes building new deepwater ports at the cost of billions to address the complexity of greater depths than in the North Sea and of course we have no baseload nuclear.
One comment. Lets assume the UK relies to a significant extent on gas and collects the global "cost" figure for CO2 of c. 150/t, this means a very substantial saving would still be achieved but a huge sum would be collected. The "environmental / political" deal could then be that this is spent / invested in geographies were much greater emissions savings are possible.
A dollar spent on offgrid rooftop solar in Nepal would most likely achieve greater emissions reductions than forcing wind onto the grid on Northern Europe. Its a win for the taxpayer, the environment and possibly a school or hospital somewhere too. I suppose this would be ruined by a ridiculous carbon trading system but we need to get beyond ideologies if it clearly makes sense to burn and pay in Europe and achieve more elsewhere.