
The Sun Never Leaves
How emigration ended the British Empire

Once an empire existed on which the sun did not set for over two centuries. Soon the sun will set because that country is paying £18bn to give away its last naval base in the Indian Ocean. What happened?
Britain’s slide from global hegemony to irrelevance wasn’t because it once had the world in GDP per capita, but is now doing famously badly relative to other developed countries. Income gaps among rich nations are modest, and weaker economies like the USSR (never above 43 % of US GDP per capita) still packed strategic punch.1 What shrank Britain’s weight was not low fertility either—its birth rates stayed high, at least until WW1—but mass emigration. The people, and the children they would have had, simply left.
Over the 19th century, UK emigration averaged 0.5% of the population per year. About half of migrants eventually went to the US, with the remainder primarily going to Canada, Australia, New Zealand, with smaller numbers going to various African colonies, primarily what is now South Africa. In this post, I model a counterfactual where emigration of British citizens was zero since 1815, and compute the corresponding UK population.
Model and results
How can we estimate the population absent emigration? The naive solution—just add every emigrant back into the headcount—ignores the children those emigrants would have had. A cleaner method strips migration out of the growth rate itself: start with the observed population, subtract net migration each year as a share of the total, and let that adjusted growth rate compound forward. The result is a population path that implicitly assumes net migration is zero for the entire period.2
The core emigration series was pieced together from A History of Emigration for 1815-1911 data, some 1920s Parliamentary questions on migration, a statistics handbook for 1948-1950, the post-1960 UK emigration records. Data for 1930-1947 was not readily available and was assumed to be zero for the sake of conservatism, and data for 1951-1960 was inferred from the net migration rate, meaning for both these periods actual outflows were likely notably higher. Data pre-1870 refers to every person who left via ports in Great Britain to emigrate to a long distance destination, and thus includes some individuals who transited through British ports for immigration purposes without being British themselves. Post-1870 data refers to British citizens only (or British subjects as they were known before 1949). Pre-1850 net migration was not available directly, and was imputed at 60% of the level of emigration, on the grounds that 40% of emigrants later permanently returned. All of Ireland is excluded from the data pre-1922, but post-1922 data includes Northern Ireland.
This methodology would imply a population of the UK today at slightly above 150mn. However, this ignores the potential effects of any emigration on fertility. Firstly, might there be some effect lowering the standard of living from the higher population, which could lower fertility? Under the classic Solow model of economic growth, this would occur, but not by much. The higher rate of population growth would depress the capital stock per capita - fewer machines per worker - reducing GDP per capita by about 4.7%.3 Substantial, but not large enough to interrupt this population boom in its tracks. Secondly, the higher population would enable larger scale effects for cities - about 4% per doubling per Duranton and Puga (2020). If this larger population was sorted into cities at exactly the current distribution of size, this would by now have more than counteracted this decline, although it would have reduced fertility in the interim, and is hence included.4 Additionally, a majority of migrants were male, causing a demographic imbalance in the UK - in 1850 there were 500k more women than men, implying 0.9% higher fertility in the 19th century without this (assuming monogamy).
Most of these effects are fairly small in magnitude however - adding up to a 5mn change in expected population. This is because the elasticity of fertility to income in the 18th century was fairly small - Klemp (2012) found 0.31 to wages, while Foreman-Peck (2015) found 0.13 and Clark (2007) found essentially zero - implying minimal changes in TFR given the already small changes in wages. 0.2 will be used here for the sake of conservativism.
The biggest upward revision comes from the emigrants’ own future families. Most left as adults: they had already survived the brutal childhood mortality of the 1800s, yet 80 % were still in the 15-50 age band, with the bulk clustering in their twenties. That means they carried more unspent fertility than the average Briton at home. Adjusting the model for this higher expected childbearing (and noting that our lack of fine-grained age data likely understates the gap) pushes the population trajectory to the higher line shown in the next figure.
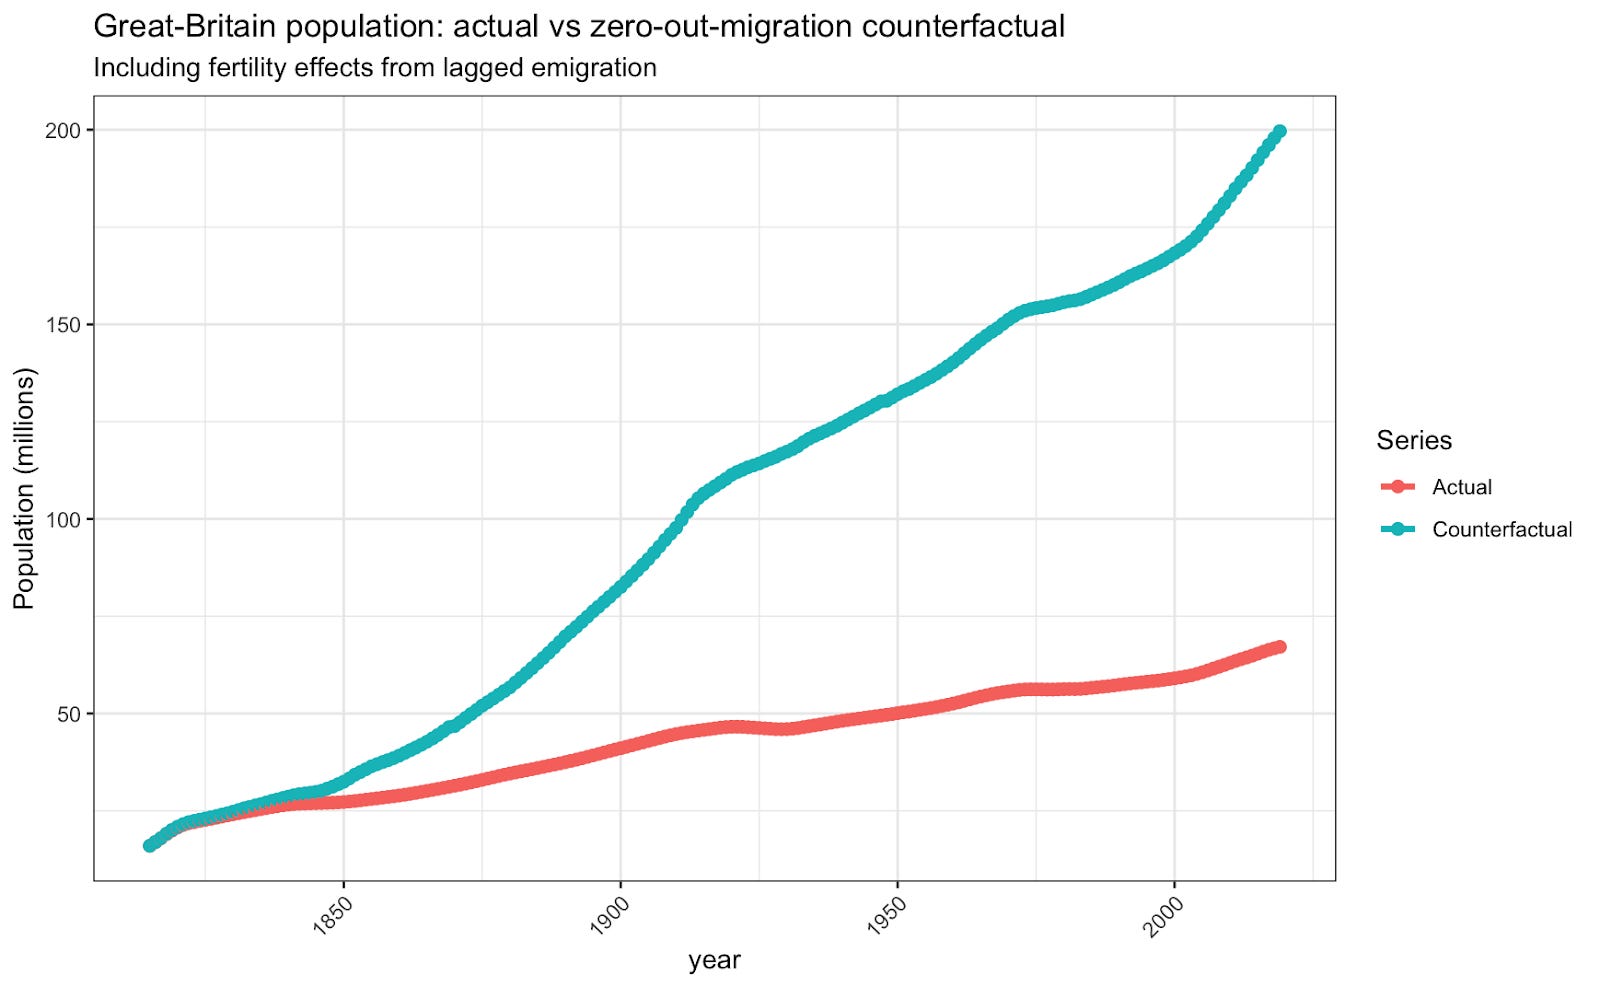
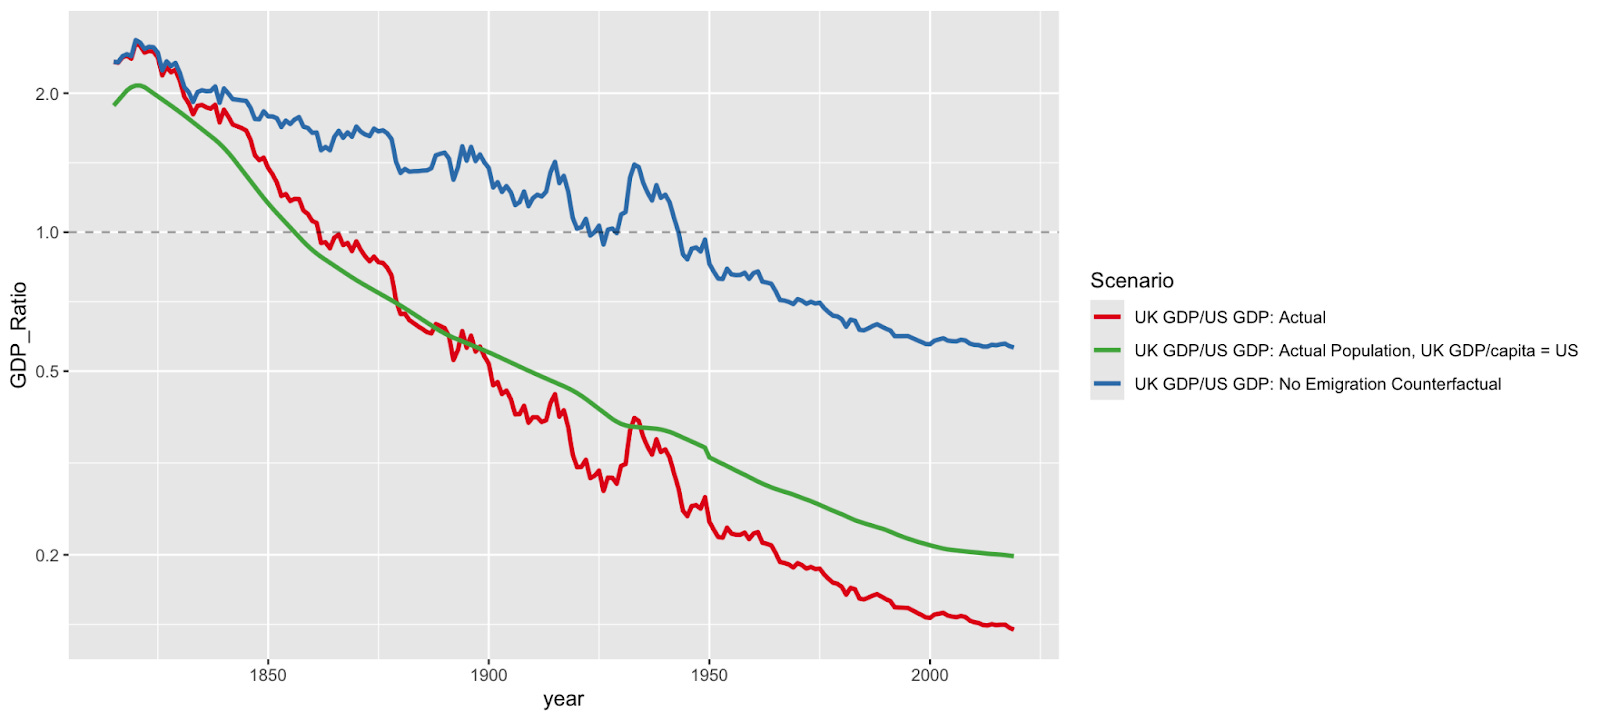
With the fertility boost included, Britain would now house just over 200 million people instead of 70 million. How would that reshape the Anglo-American balance? The chart below offers a clue—though it likely understates the change. Our UK-to-US migration counts cover only 1815-1920 and 2000-2022, and the earlier series records passengers sailing directly from British ports, missing those who detoured through Canada for cheaper fares. Even with these gaps, emigrants from Britain over the period summed to 13.4 % of the 1920 U.S. population, implying that America today would be roughly 23 % smaller had those people, and thus their descendants, stayed put. A bigger Britain and a shrunken United States would bring their economies much closer in scale.
Discussion
A Britain of 200 million would have stayed neck-and-neck with the United States; its relative GDP to the US would be today roughly where it historically stood in 1899, perhaps higher had the Victorian colonies remained. But keeping everyone at home looks like a very large welfare loss. Britain’s relative poverty is probably rooted in planning rules, not people, while the emigrant destinations—Australia, Canada, New Zealand, and, above all, the US—have long out-earned the old country. Additionally, public-goods spending grows more than one-for-one with a country’s heft. America’s sheer scale makes it rational for it to invest much more as a share of GDP in defence, biomedical R&D, and green-tech subsidies than the UK or individual EU countries; trim that scale and the super-sized contribution shrinks disproportionately. Half of Britain’s outflow went elsewhere, so the net effect on global public goods is reduced but still likely negative, and although an extra boost to the Allies in two world wars is plausible, it does not outweigh the peacetime gains long enjoyed already enjoyed by the emigrants’ descendants, and the global benefits from higher public goods production.5 6
Conclusion
The UK ultimately lost international power because a very large percentage of its population left for greener and more pleasant lands overseas. However, the scale of emigration was so large that, by the 1980 census counts the US has more people of British descent than the current UK does - 75mn scaled to all who reported that year, versus only 56mn citizens in Britain proper in 1980, and 70mn today.7 8 By the absolute number of its inhabitants, the US might well have a better claim to be the successor state of Victorian Britain than the current UK does. After all, the sun sets on the US for less than a thousand hours a year.9
Indeed, this figure is from 1990 - and any claim that Soviet living standards were at their peak in 1990 would be completely at odds with contemporary discussion, suggesting the actual peak was plausibly much lower.
Note that the effect of this higher population on the UK’s level of attractiveness to migrants is ambiguous as wages would plausibly be lower first order but innovation would be higher - and as migration is partially about the supply of visas not just demand, the UK population would probably be willing to accept more migrants given a higher native population given higher assimilation ability.
Given 0.5% higher population growth, this would imply a fall in non-agricultural wages of 4.8% given 5% depreciation, 1% productivity growth and 0.5% baseline population growth in the Solow model. This is because in this model higher depreciation of capital reduces income per person by making there less capital available per person. From the perspective of an individual, it doesn’t matter whether a unit of capital is unavailable because it wore out or because another worker is using it; hence depreciation and population growth have analogous wage implications.
Increases in city scale would also likely imply greater innovation, but these people would not be in the US (which is unusually innovative for its population size) meaning the net effect on innovation is ambiguous, and hence will not be considered.
Depending on the year 2013-2018 NATO data gives a coefficient of log GDP of 0.22-0.33 when predicting defence spending as a share of GDP, depending the year. This suggests that if the UK population was 2.86 times its current level, and the US population 23% lower, UK defence spending would rise by about 33%, and US defence spending fall by 7%. As US defence spending is slightly above an order of magnitude above UK defence spending, this suggests total provision of defence spending would fall (to say nothing of the loss of the defence output of the countries UK migrants were no longer moving to).
Historically, the key strategic weakness of the British Empire was that while London’s resources were theoretically vast, they could not be deployed at the same time. In peacetime, India paid for 256,000 troops - but during WW1, Indian defence spending only reached 5% of GDP, compared to about 3% in peacetime. For comparison, UK defence spending went from 3% in FY 1913-1914 to 52% in FY 1917-1918. Meanwhile the Dominions did fully commit to both world wars, losing a comparable proportion of their male populations in both conflicts to the UK - but their pre-war defence spending was minimal. In 1939 Australia spent but 1% of GDP on defence, despite coming close to invasion by Japan 3 years later. In general, Dominion contributions were very large, but very late - e.g. Vimy Ridge was one of the most successful Allied offensives of 1917, but occurred 2 months after the February Revolution had close to knocked Russia out of the war, and was the first significant Canadian action of the war, 3 years after it had first started. This is of course to say nothing of the even later US involvement in both wars. Had these resources been committed earlier, either conflict could presumably have been brought to a finish much sooner, and at much lower cost - and pre-war defence spending would have also likely been higher due to a reduced ability to free-ride.
The 1980 census counts are the most recent to accurately capture British ancestry, as post-1980 an American ancestry category was added which is mostly UK ancestry, but the exact breakdown is unclear and hence the 1980 data will be used as they are more reliable.
Adjusting for ancestry of UK citizens would of course make the comparison even more striking.
Method for this: the westernmost, northmost etc extremities of the US form a box defined by American Samoa, Wake Island, St Croix and Utqiaġvik. US territory within this box can only be in sunlight if one of these four points is in sunlight, and the sunrise gap varies from 2 hours in summer to 4 hours in winter. During summer, the northernmost parts of Alaska are continuously in sunlight, thus the sun sets on the US for slightly over 10% of the year, or 955 hours to be exact.
You might want to take a look at https://www.nber.org/papers/w33542
France had much lower net emigration but declined in power more steeply. The problem with the British Empire was that productivity and military capacity was very low in non-settler territories. In the Great War, the home islands contributed about 6 million with the White Dominions adding about a million. 'Coloured troops' were only about 1.5 million and of those only about 300,000 were high quality. In the Second War, there was greater 'coloured' participation but the fact is the Indian army didn't stand a chance against the Japanese without UK help. However, even then, it was US air support which was crucial. Interestingly, the Japs raised productivity a lot in their colonies (Taiwan & Korea) because they were ruthless. The Brits were nice guys. They ruled India the way the Indians wanted. Sadly, this was also a way which made the sub-continent less able to feed or defend itself or protect minorities.
It must be said, the UK was quite socially divided for a period of time. The 'Class War' may have been polite and courteous but it did turn the country into what Sir John Hicks called a semi-centralized socialist economy where the rate of profit was regulated by politicians. Indeed, this was the reason UK had net emigration till the mid Nineties.