

Since 2020, the UK has had 9 net migrants per 10 native births - an average of 548,000 per year. One frequent concern raised in response to this is that this migration is net fiscally negative. Ex ante, it isn’t that unreasonable to think it is - income differences between countries partially stem from human capital not just physical capital or institutions, and if migrants bring their low human capital with them we might expect them to earn less, pay less tax and be net fiscal drains. Indeed, a much-cited ONS study from the end of 2024 concluded that while most migrants are net fiscal benefits, lower-wage migrants represent a net fiscal drain.
In this post, I investigate the ONS numbers, finding several methodological issues that suggest that they have substantially understated the benefits of migration. I then analyse the steady-state impact of varying migration flows, finding that maintaining current spending levels is impossible at any fertility rate without migration at or above 2015-19 levels. With sufficient migration, transfers to the elderly could be over twice what they would otherwise be; without it, even abolishing the state pension entirely wouldn't achieve solvency. While some migration is certainly fiscally negative, for which there might be a strong case for removing, it seems likely that a majority of current migrants are net fiscally beneficial.
That ONS graph
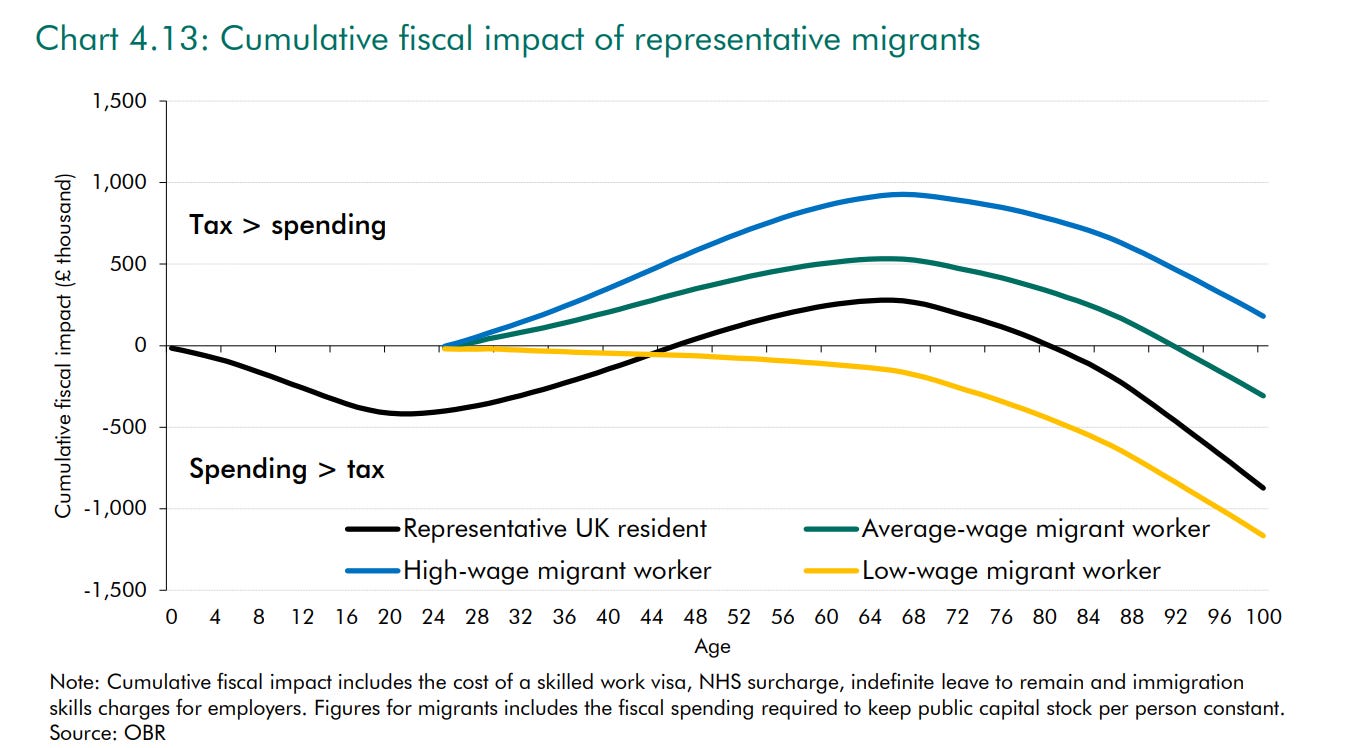
Perhaps the most famous analysis here for the UK is a widely-cited study last year the ONS released last year showing that while medium and high-wage migrants outperform natives fiscally, low-wage migrants perform substantially worse. In their modelling, while migrants are fiscally positive evaluated earlier in life compared to natives as they avoid the need for education expenses, lower wage migrants never earn enough at any point to fund spending on them. However, this analysis contains several methodological issues that limit its applicability.
First, the study's categorization is technically correct but somewhat misleading. It doesn't compare low, average, and high-wage recipients of work visas, but rather low, average, and high-wage migrants who work. Their "low-wage migrant" earns 50% of the median wage - but the minimum wage for full time employment is 65% of the median wage, and migrants do not differ much in their distribution across full vs part time employment than natives. Since such a migrant likely wouldn't qualify for a work visa, these individuals are probably dependents of higher earners whose fiscal impact shouldn't be assessed in isolation.1
The study also contains several more direct analytical problems:
No discounting: The analysis treats government borrowing for education as cost-free, ignoring decades of interest between educating 10-year-olds and collecting their peak tax contributions in their 50s.
Public goods omitted: Fixed costs like defense and debt service don't scale with population, making per-capita calculations misleading.2
Emigration ignored: 12% of migrants leave after age 65, reducing pension costs.3
Capital stock levels ignoring population growth: The study assumes full public capital adjustment under migration, though the optimal per capita capital stock actually decreases under higher population growth scenarios.4
Replicating with Corrected Methodology
Using ONS ASHE tables for native income distribution and Labour Force Survey data for non-citizen wages, I find migrants earn on average 6% less than natives.5
UK tax collection, however, exceeds pure labor income analysis by 1.9x due to progressive taxation (meaning median earners pay below-average rates) and non-labor revenues.6 I assume tax contributions follow the labour-income-tax curve.7 Conservatively, I multiply immigrant tax contributions by only 1.7x (inverse of labor share) rather than 1.9x.8
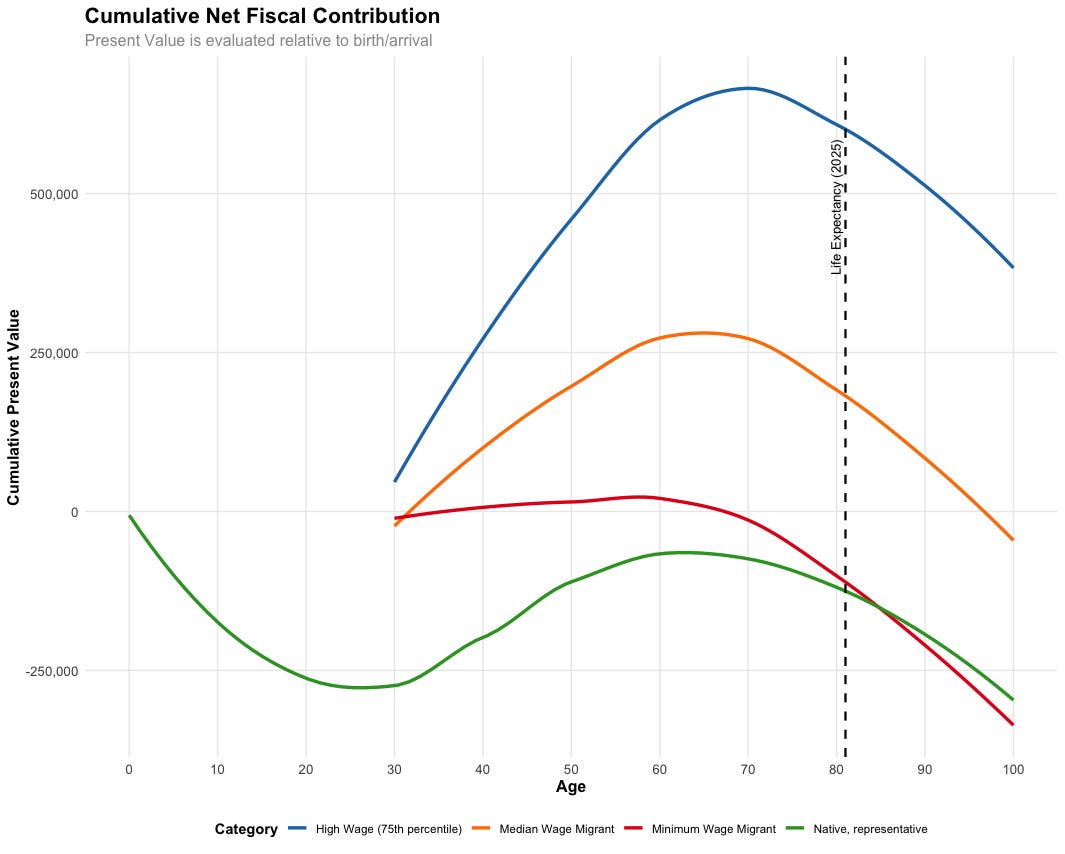
With these corrections, all workers are fiscally net positive at current life expectancy, though minimum-wage migrants only marginally so. Note that as life expectancy increases, low-skill migrants become increasingly fiscally negative. This occurs because migrants arrive at age 25, making their retirement closer to the evaluation point than natives (who are evaluated from birth). Consequently, retirement costs are discounted less steeply for migrants.
Children pose minimal fiscal concern since second-generation migrants in the UK perform equal to or slightly better than natives. Including them would simply compress the differences between groups.9
For spouses, I apply maximum conservatism by modeling them as minimum-wage earners using the highest gender labor force participation gap among major migrant groups.10
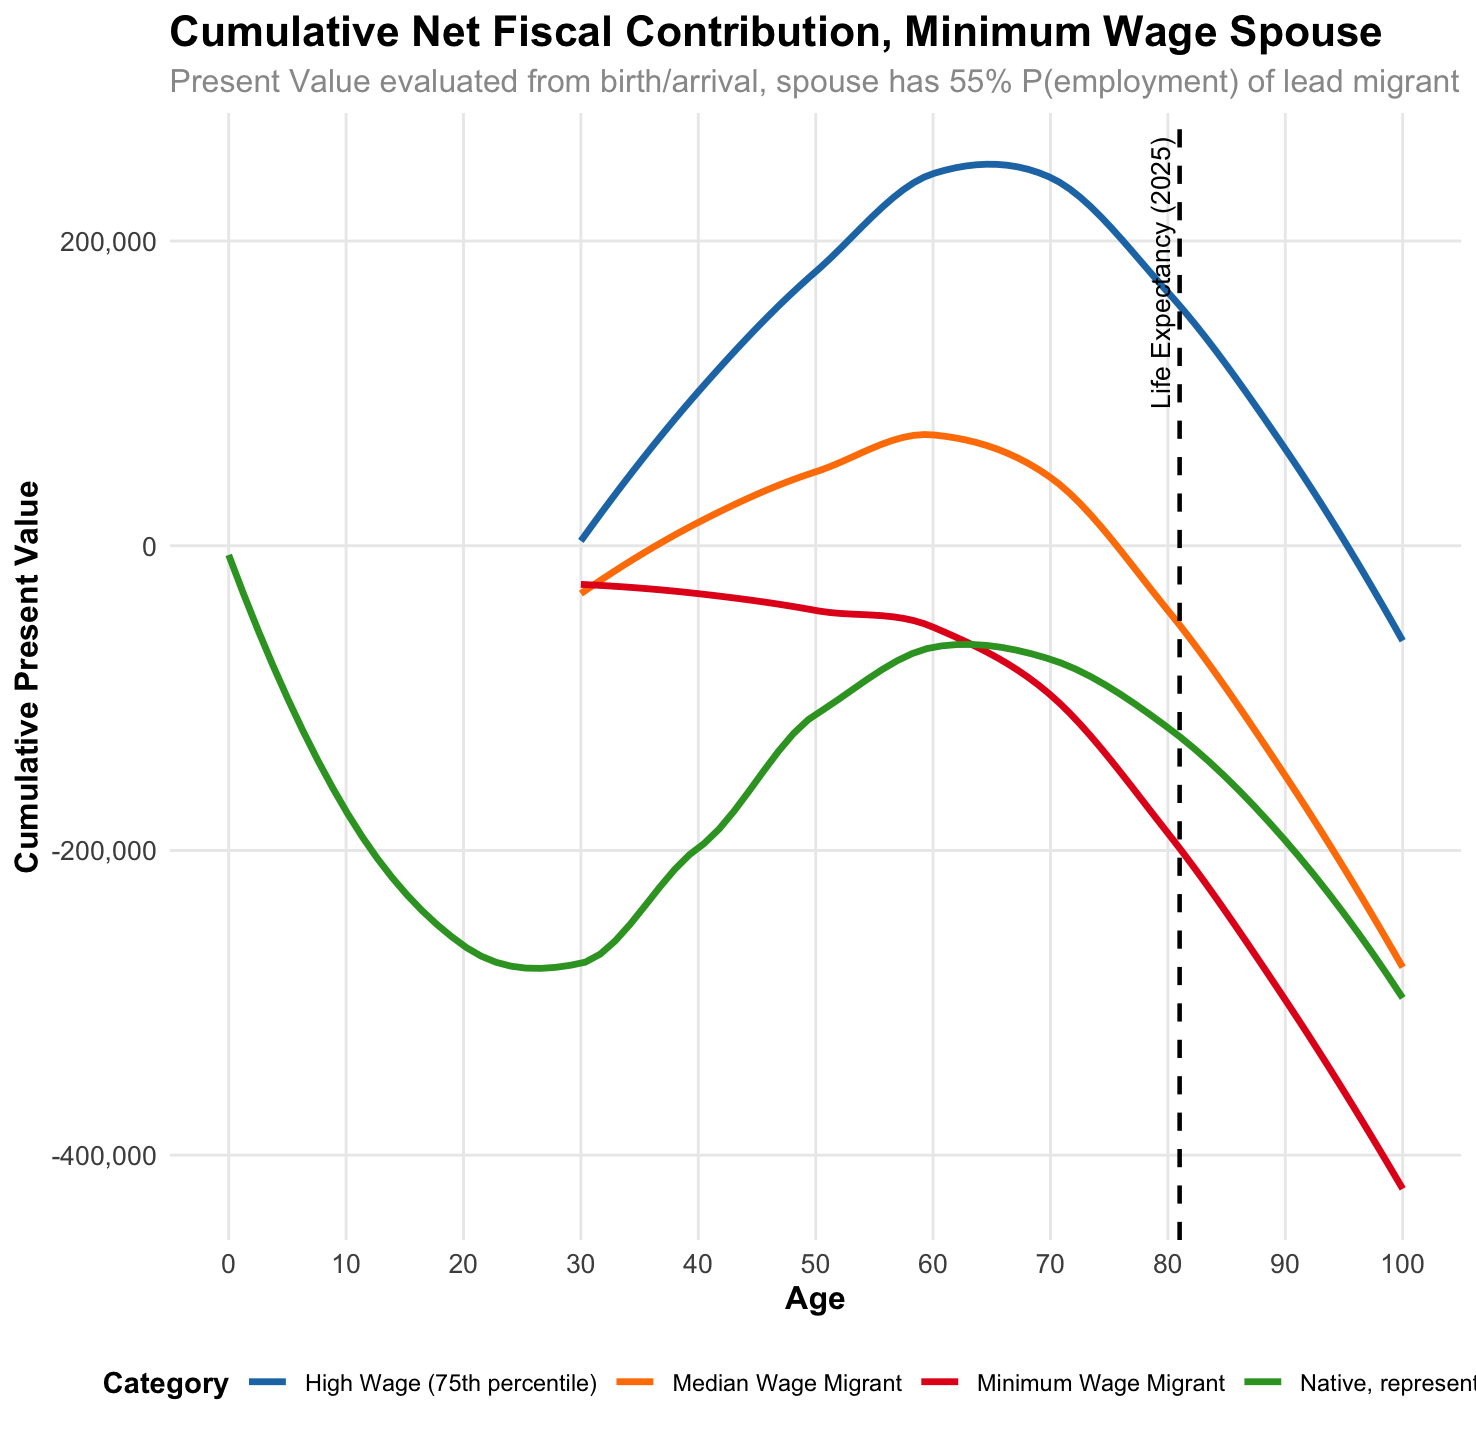
Medium-wage migrants remain significantly net positive. Note that this means that it is fiscally positive to admit a substantial majority of current migrants - not just work visa recipients, but migrants - even in the fiscally worst possible case regarding dependents. Minimum wage migrants, however, shift from barely positive to substantially negative, implying that not all work visa recipients would be. However, as the median work visa recipient earns a higher salary than the average migrant, this implies that a majority of existing migration is fiscally positive.
Insolvency
Low-skill migrant workers and medium-skill workers with low-earning spouses are indeed fiscally negative in absolute terms - but natives are even more so. This apparent paradox resolves once you understand that the UK is fundamentally insolvent under current policy.
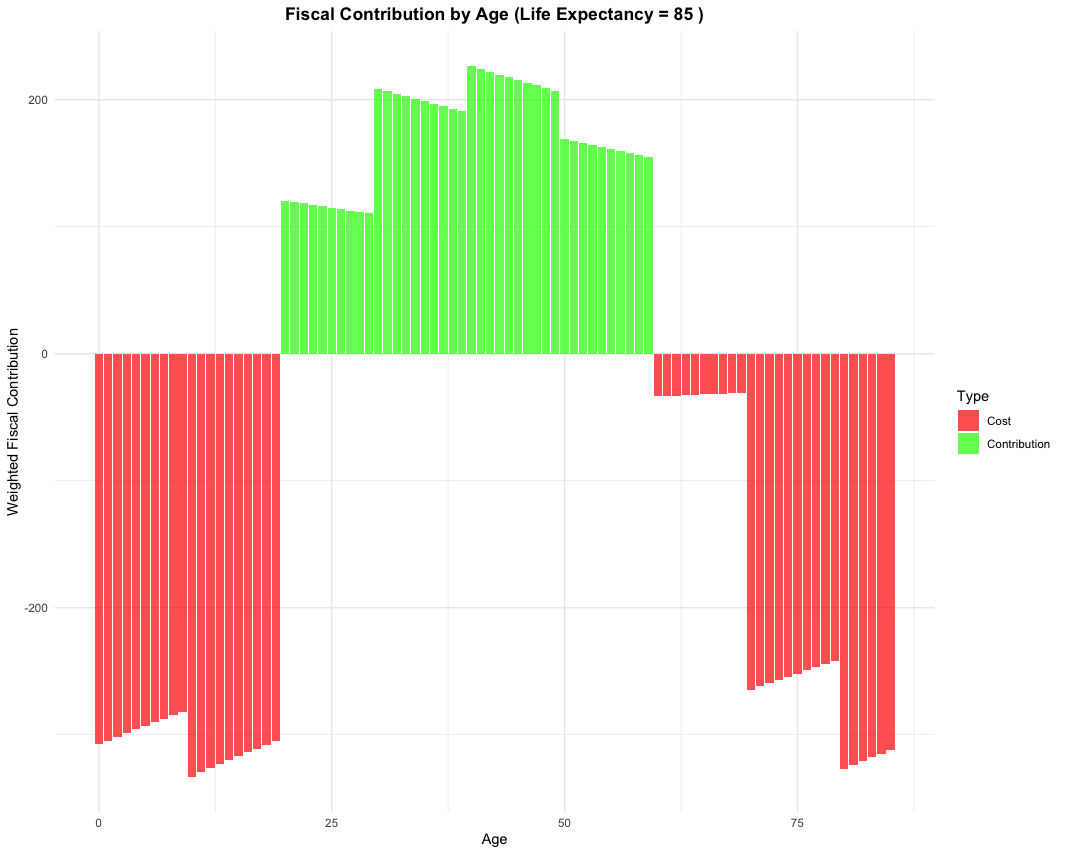
Working-age tax surpluses never compensate for education costs and the escalating burden of pensions and healthcare in old age. Current deficits appear manageable only because past high fertility and lower life expectancy created a temporarily favorable age structure. As this demographic dividend expires, the fiscal gap will widen dramatically. Migrants who are fiscally negative in absolute terms but outperform natives still improve the overall position, reducing the scale of the eventual required tax increases or spending cuts.
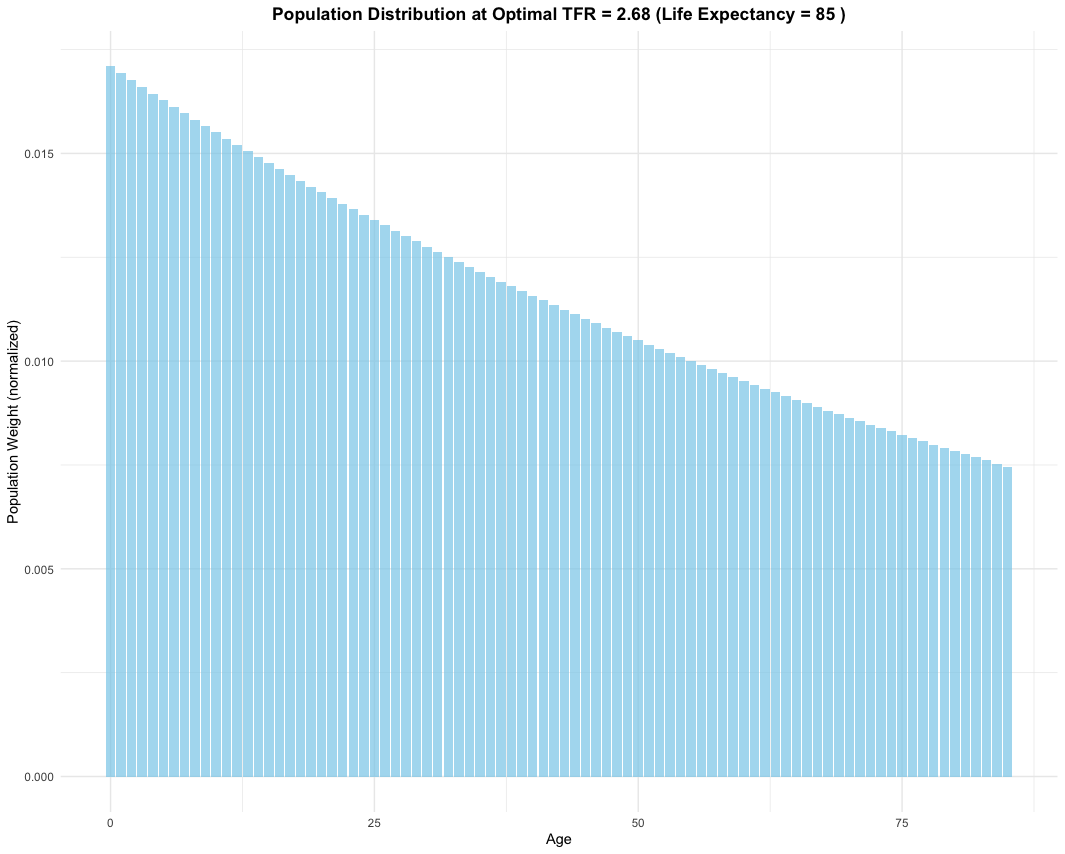
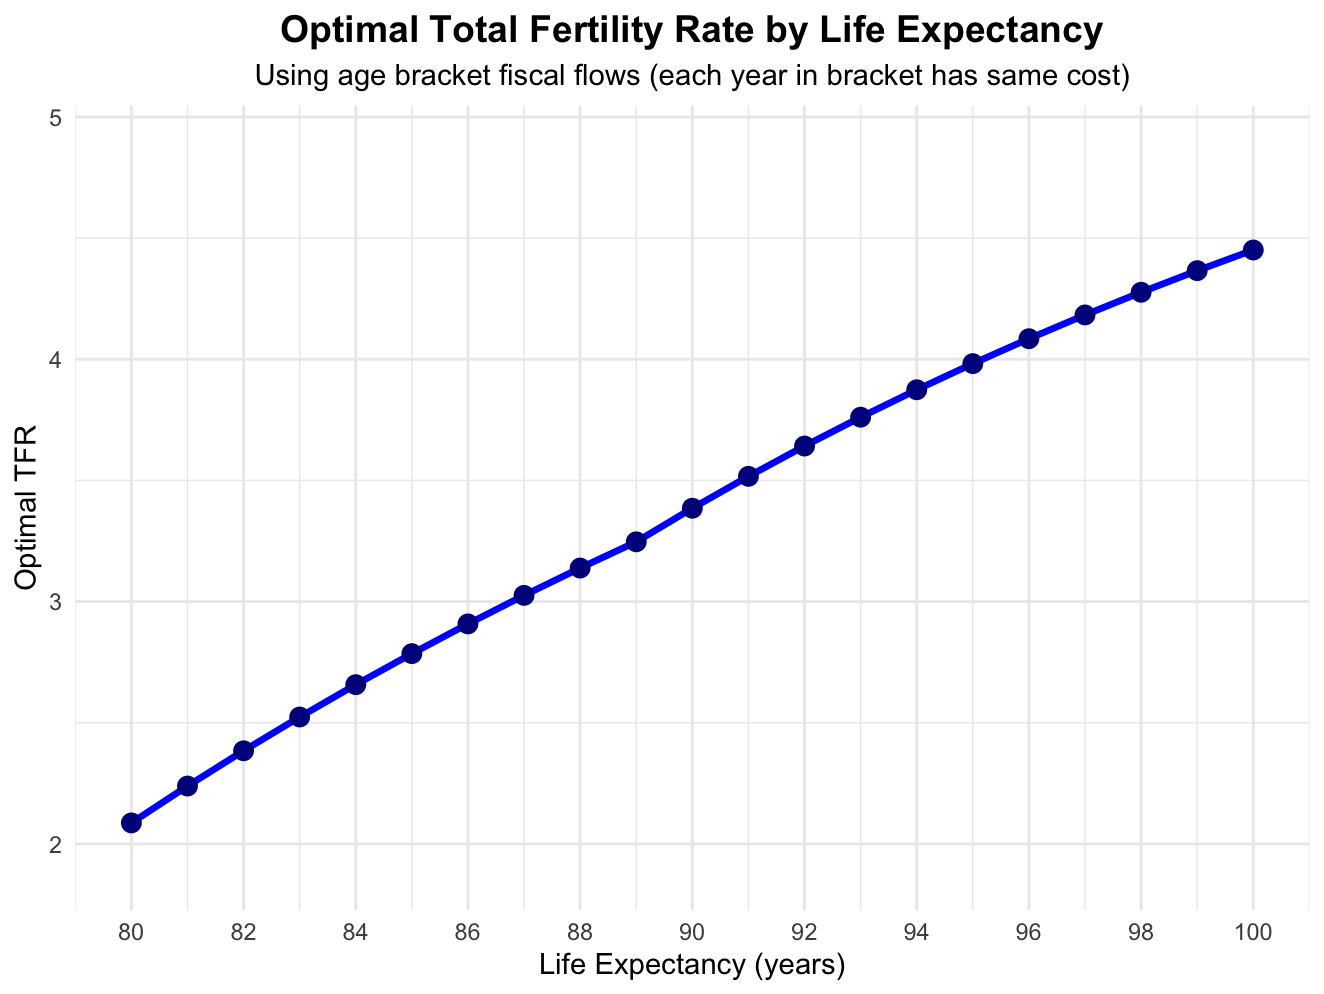
Two parameters drive fiscal sustainability: life expectancy and fertility. TFR determines the population pyramid's slope - at a TFR of 3, each generation is 1.5x larger than the one 30 years older.11 Since individuals consume state resources heavily at life's beginning and end, the optimal balance between these cohorts depends on their relative costs. As end-of-life costs scale with life expectancy, longer lifespans push optimal TFR substantially higher.
To quantify these effects, I use the government's illustrative income tax costings to raise all rates by 1pp.12 I calculate "optimal" fertility as the TFR that minimizes required tax changes - a purely demographic optimization that ignores both the costs of achieving higher fertility and its benefits through innovation.
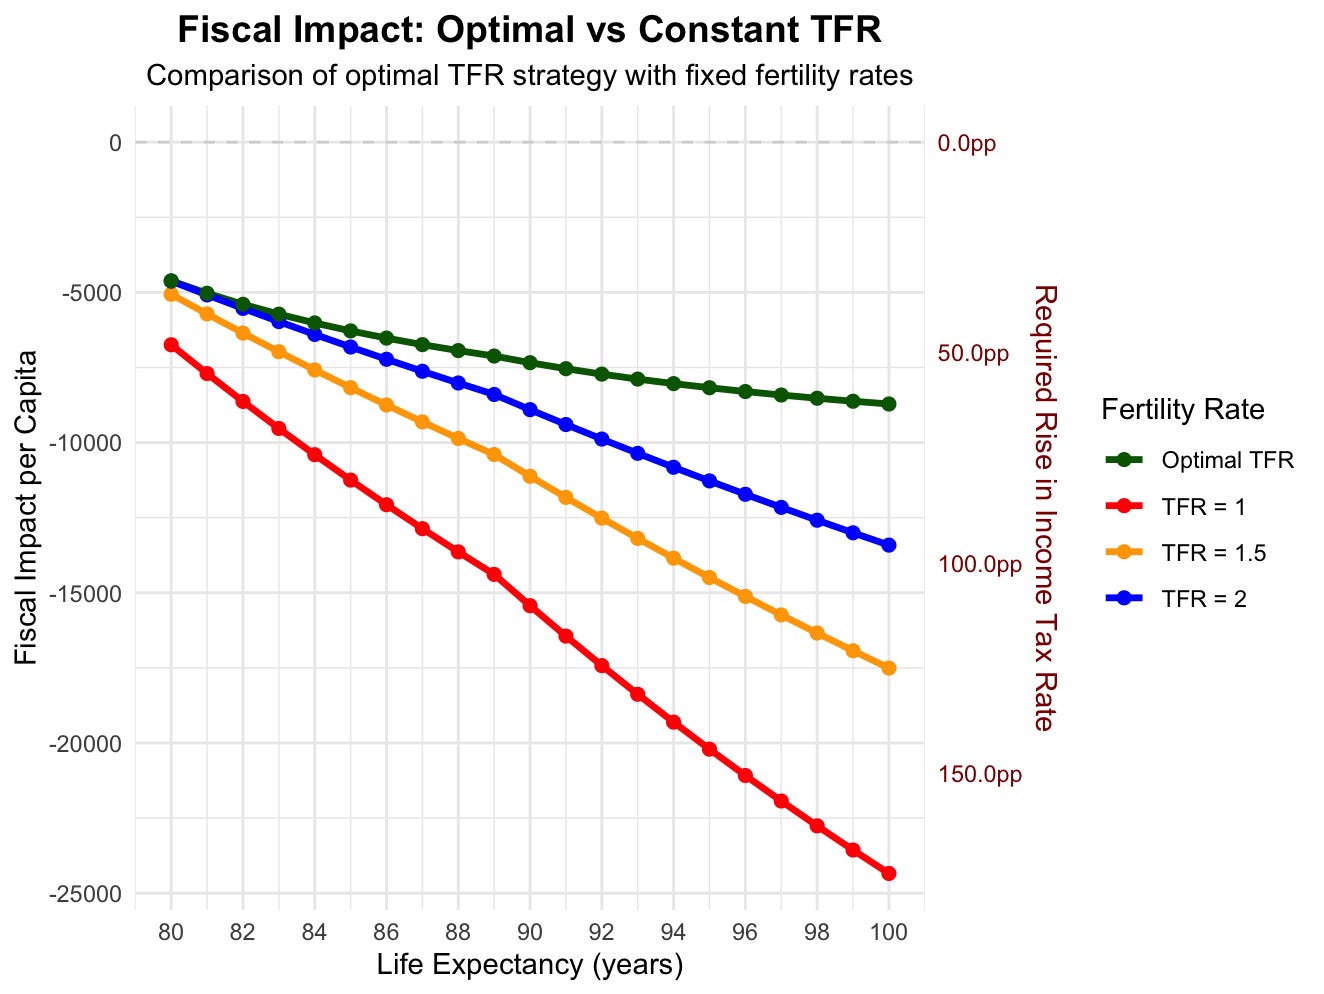
The results are striking - required tax rates quickly exceed 100%. If life expectancy increased just 4 years beyond current levels, the UK's fiscal position would become mathematically untenable at current fertility rates, even before considering behavioral responses.
A surprising pattern emerges regarding optimal TFR: while it rises dramatically with life expectancy, the marginal benefits diminish sharply for increases above replacement rate. At 100-year life expectancy, raising TFR from 1.5 to 2.0 provides identical fiscal gains to raising it from 2.0 to 4.5. This suggests that reaching replacement fertility captures most available demographic benefits, with further increases yielding minimal returns.
Immigration
So how about we add in some immigration? Using current migrant income distributions, I model immigration at 25%, 50%, and 100% of birth cohort sizes - roughly corresponding to 150k, 300k, and 600k annual arrivals in the UK. For context, immigration averaged 548k from 2020-2024 and 258k from 2015-2019.13
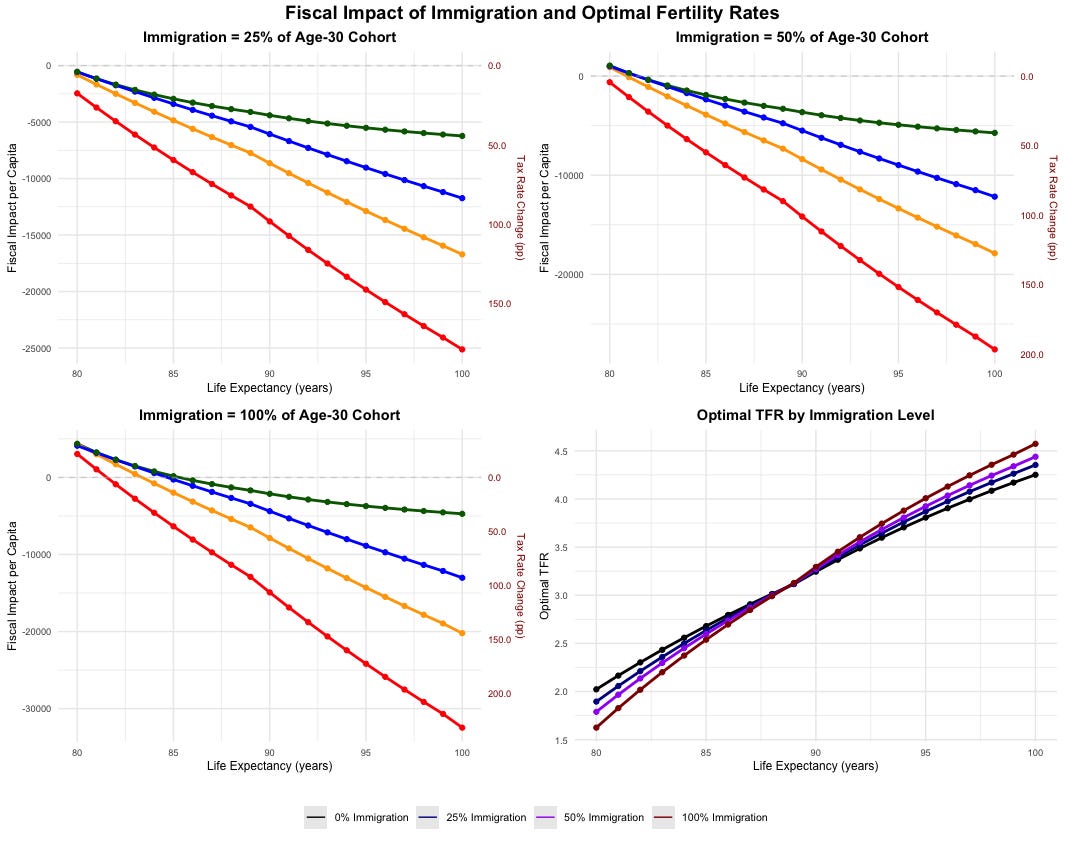
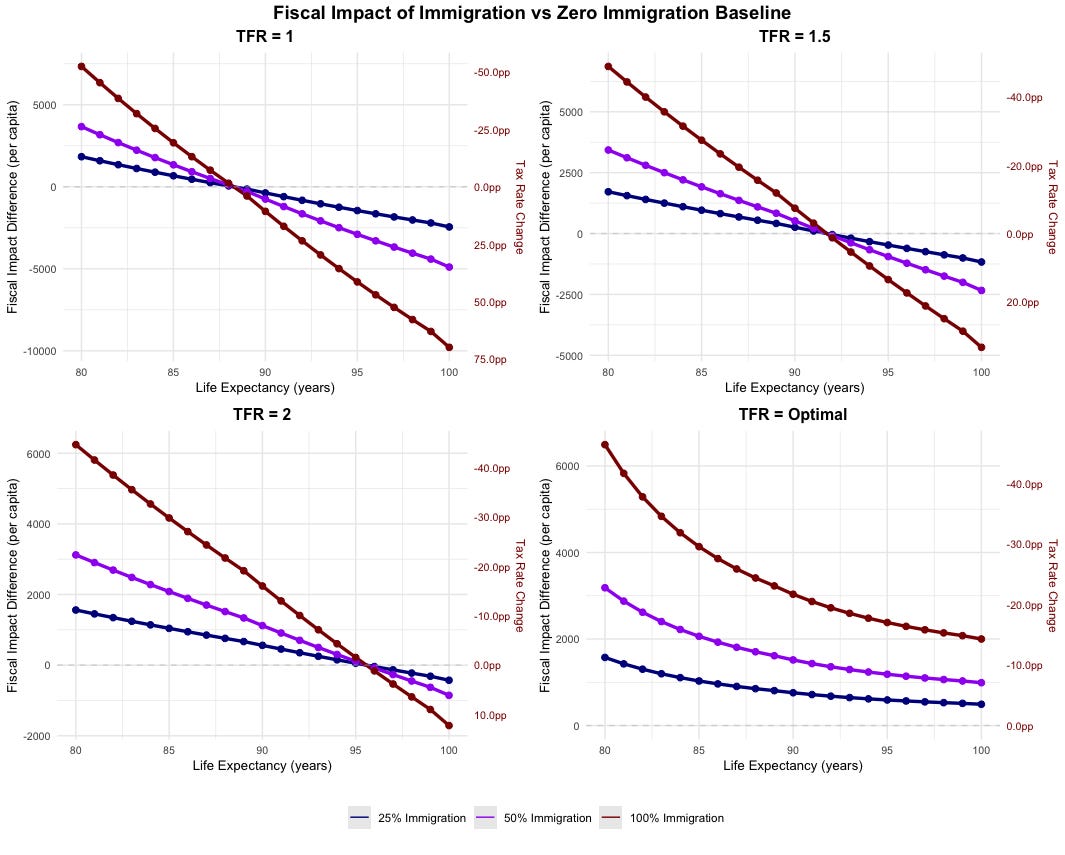
This didn’t have the effect we expected! Under these graphs, at any given TFR immigration is positive today but negative if life expectancy rises sufficiently. This counterintuitive result stems from the population being normalized to a constant level. Since migrants arrive at age 25, maintaining a constant population requires 1.33 migrants per native at 100-year life expectancy, or more at lower life expectancies. Immigration can then appear negative if migrants' annual fiscal impact from ages 25-death exceeds natives' cost from ages 0-25.
But this comparison reveals the absurdity: natives under 25 cost the exchequer an average of £14k annually - nearly half of GDP per capita. Immigration thus only appears negative when the baseline deficit would exceed 50% of GDP, a fiscally impossible scenario.
Paths to Solvency
Since 100%+ tax increases are impossible, solvency requires reducing end-of-life fiscal deficits through retirement age increases, medical technology breakthroughs, faster growth with benefits fixed in absolute terms or direct transfer cuts, either through a lower pension or worsening healthcare provision.14
How does immigration affect the scale of these necessary adjustments?
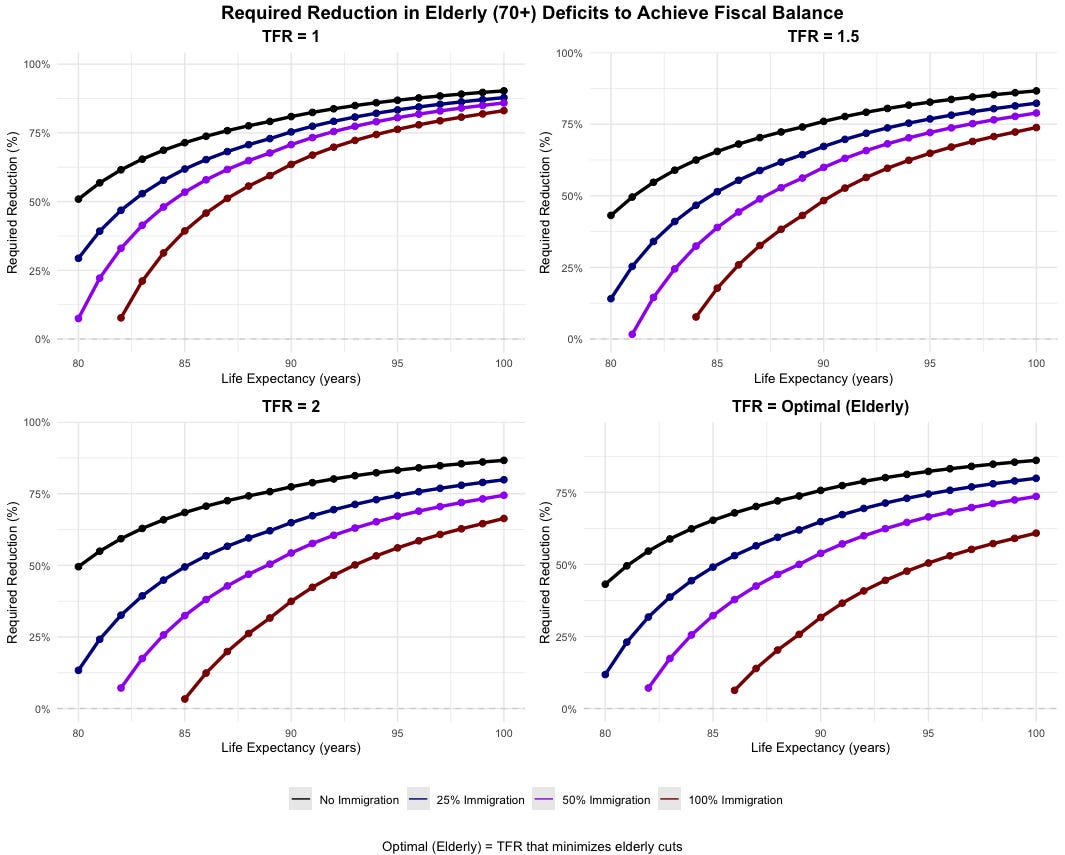
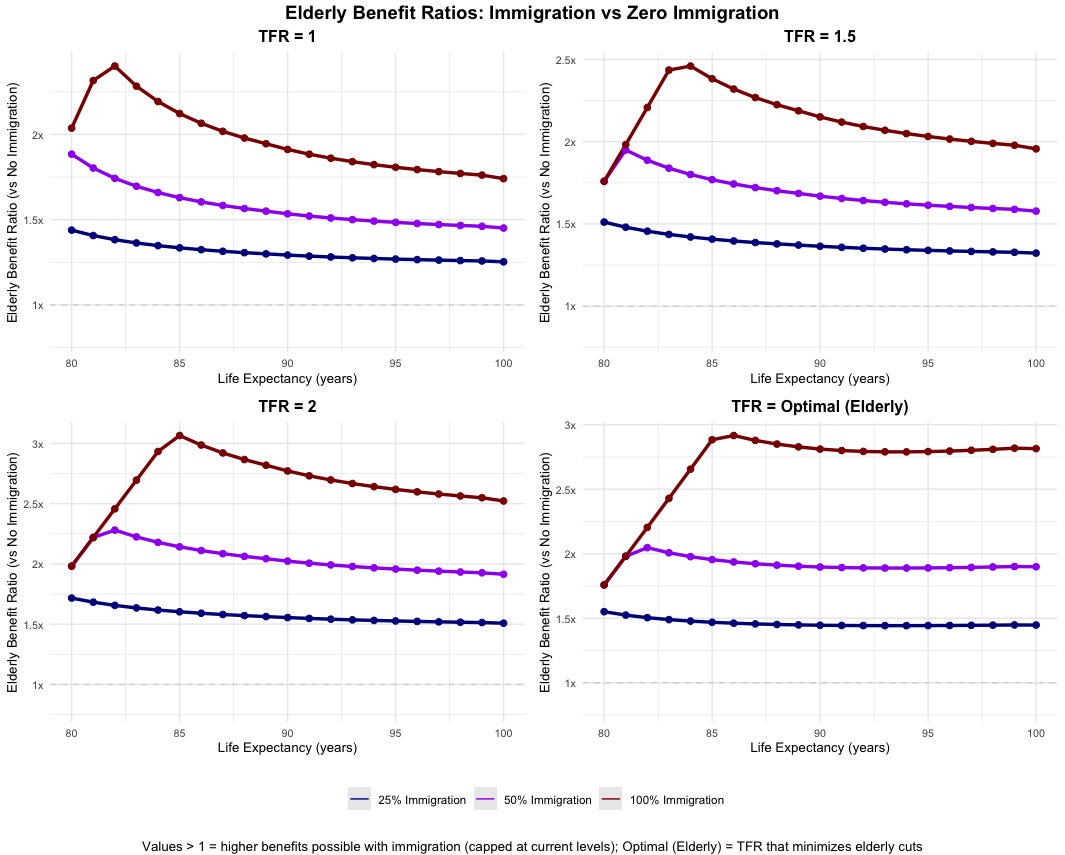
With zero immigration, transfers to the elderly must be halved even at current life expectancy. Since the state pension represents only one-third of elderly transfers, even complete abolition of the state pension wouldn't achieve the necessary savings. Immigration dramatically alters this calculus. At sufficient levels (300k annually), the UK could maintain current benefits at today's life expectancy. Even with substantial life expectancy increases, high immigration could support benefits at twice the levels possible without it.
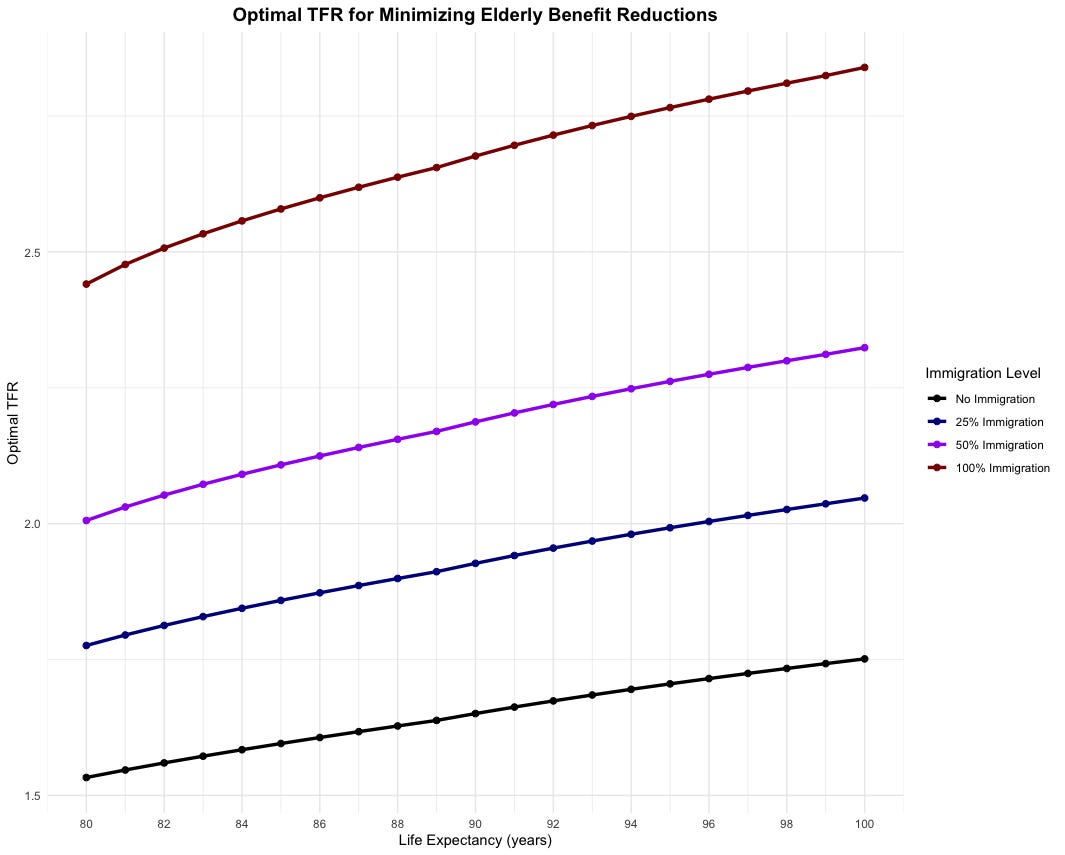
Interestingly, optimal TFR is strongly increasing in immigration if deficits are to be plugged by cuts in elderly transfers.15 Each native birth now effectively produces more than one 30-year-old worker, as immigration amplifies the working-age population, while the cost of a native birth has stayed constant. This multiplier effect substantially raises optimal fertility at any given immigration level.16
However, even at optimal TFR, without immigration steep pension cuts remain necessary. Fertility adjustments alone, regardless of how successful, cannot solve the fiscal challenge - they can only moderate the severity of required reforms without some assistance from immigration.
Discussion
The analysis already incorporates migrants' impact on public capital stock requirements - all figures are net of investments needed to maintain optimal service quality. Immigration may provide additional unmodeled fiscal benefits through labor market effects. Government control over migration levels, combined with its focus on fiscal outcomes, enables strategic use of immigration to moderate wage pressures in state-dependent sectors like social care and the NHS.
Could higher growth avoid the need for this? In practice, not really. Costs are primarily here driven, especially in lower fertility worlds with longer life expectancy, by expenditures post-retirement on healthcare and pensions. UK pensions are triple-locked, rising annually by the highest of wage growth, inflation, or 2.5%. This means pensions inexorably increase as a share of wages whenever growth falls below 2.5% or inflation - making even rapid growth unable to reduce the pension burden relative to GDP.17
Healthcare costs face a similar trap. Baumol's cost disease ensures that healthcare’s costs rise over time - as other sectors grow more productive faster than healthcare, they bid up wages, forcing healthcare to pay more for the same labor-intensive services.18 Additionally, healthcare has an income elasticity of demand much above 1, so healthcare spending tends to rise as a proportion of income following growth. Unless either labor's share of income falls dramatically or healthcare somehow rises in productivity much faster than the rest of the economy, no amount of abundance can overcome demographic arithmetic.
Conclusion
There are four ways to improve migration policy: accept beneficial migrants we currently reject, reject harmful migrants we currently accept, attract high-value migrants who currently choose other destinations, or reduce administrative costs. While there are certainly many problems that tightening admission standards would be helpful in resolving (and which solving would be fiscally beneficial!), the fiscal arithmetic constrains how far this can go. A majority of current migrants are likely net fiscally beneficial, and without them the UK could only balance the books in the long run at extreme cost regardless of growth or fertility.
Not least as these higher-earning migrants may be substantially less likely to come if they could not bring dependents with them!)
Innovation, arguably the most important public good, will be excluded here.
Note that UK citizens also emigrate, which further reduces their fiscal attractiveness. However, we lack a breakdown of emigration into native born and naturalised citizens due to data issues with the international passenger survey, and as non-native-born emigration is likely to be substantially higher this renders the current data not useable for our purposes, so for the sake of conservativism this effect will be ignored.
Higher population growth is per capita equivalent to faster depreciation, and the optimal capital stock is decreasing in depreciation rates.
Since most non-citizens arrived recently, this should address concerns about changing migrant quality in recent migration waves.
Including capital taxes like corporation tax, transaction taxes like stamp duty, land taxes like council tax, non-VAT excise duties like Air Passenger Duty etc etc.
While some non-labor taxes concentrate in later life, income volatility increases early-life contributions. I assume VAT applies at an effective rate of 10%, as VAT collects half of a full-coverage counterfactual and is distributionally neutral in the long run.
As with the ONS, I assume the current age-spending structure will persist into the future: in practice, due to the triple lock and Baumol’s cost disease, end of life deficits are likely to grow considerably. Additionally, as also with the ONS, I ignore heterogeneity in lifespan, which would worsen the expected fiscal position further as the marginal fiscal cost of a year of life rises in age.
Immigration likely doesn't affect equilibrium TFR much as migrants quickly assimilate to native fertility patterns.
Note that for purposes of evaluating the fiscal impact the median worker analysis above already incorporated non-working spouses through its use of actual average migrant wages, making it the more relevant metric for evaluating total migration impact.
Differing levels of TFR of course imply arbitrarily high or low populations, which would affect public goods levels: these effects will be ignored here.
The following graphs conservatively assume current tax yields, though in practice tax increases face diminishing returns.
Could these immigration levels be maintained without quality deterioration? In 2018, of the 750mn total potential would-be migrants, 34 million people worldwide expressed desire to move to the UK as their first choice, with another 250 million targeting other English-speaking countries. The UK-specific pool alone could sustain 600k annual immigration for over 50 years, while the broader anglophone pool extends this well beyond the expected lifespan of anyone responding to the poll today. Though the UK's appeal may diminish due to sluggish productivity growth, and not all potential migrants match current skill levels, these numbers suggest sustaining immigration at current quality levels will be feasible for decades.
Additionally, the UK currently doesn’t seem to be on its demand curve for migration admissions: a naive regression on migrant numbers and average migrant earnings in first year 2015-2024 gives no statistically significant relation for either EU or non-EU migrants, suggesting that changes in the generosity of migration policy currently have no effect on migrant quality as the system isn’t sufficiently competent at selecting better migrants for this to be the case. Note that this should only be treated as indicative as a null result could also be generated if variation in policy was much less than variation in demand.
The primary argument against this would perhaps be that UK migration is currently highly concentrated in London, with 41% of the city being foreign born vs 20% of the country as a whole, which without a major liberalisation in planning is unsustainable at higher migration levels. As London’s agglomeration effect substantially raise wages, this would then somewhat lower the wages of migrants, although note this effect is also another case where the population normalisation assumption may result in somewhat different results here.
End-of-life spending is analytically simpler to adjust than other spending categories, having minimal effects on human capital or output.
Although migration and fertility interventions are usually thought of as substitutes in demographic debates, as both help stave off population decline, in practice they may also be complementary as if innovation is one of the primary motivation for raising fertility, a higher population itself raises the value of innovation spending. This effect doesn’t feature in this model because innovation is ignored and population is normalised to a constant level.
This is roughly equivalent to a model of the country being bottlenecked on how many migrants it can admit by assimilation capacity; as migrants are net fiscally beneficial and more children allows a higher assimilation capacity so more migrants, optimal fertility is rising in immigration.
While lower growth does increase relative pension costs through this mechanism - due to low growth under the triple lock UK pensions would have grown faster than wages for 15 of the last 17 years - arbitrarily high growth cannot reverse the ratchet.
Estimates of healthcare productivity/price growth are frequently negative. To see why: suppose healthcare has a ⅔ labour share, and grows at 0.5% in productivity every year while the whole economy grows by 1.5%. Healthcare wages then have to rise by 1.5% to prevent labour moving to other sectors, raising costs by 1%, so productivity/price declines by 0.5%/annum. While in principle quality adjustments are also needed, and not included by much of the literature, quality rises in the form of higher life expectancy are fully priced into the above modelling, and it is unclear what share of life expectancy growth in past decades has come from superior healthcare.
Excellent piece, thank you.